Weather Forecasting for Home Automation
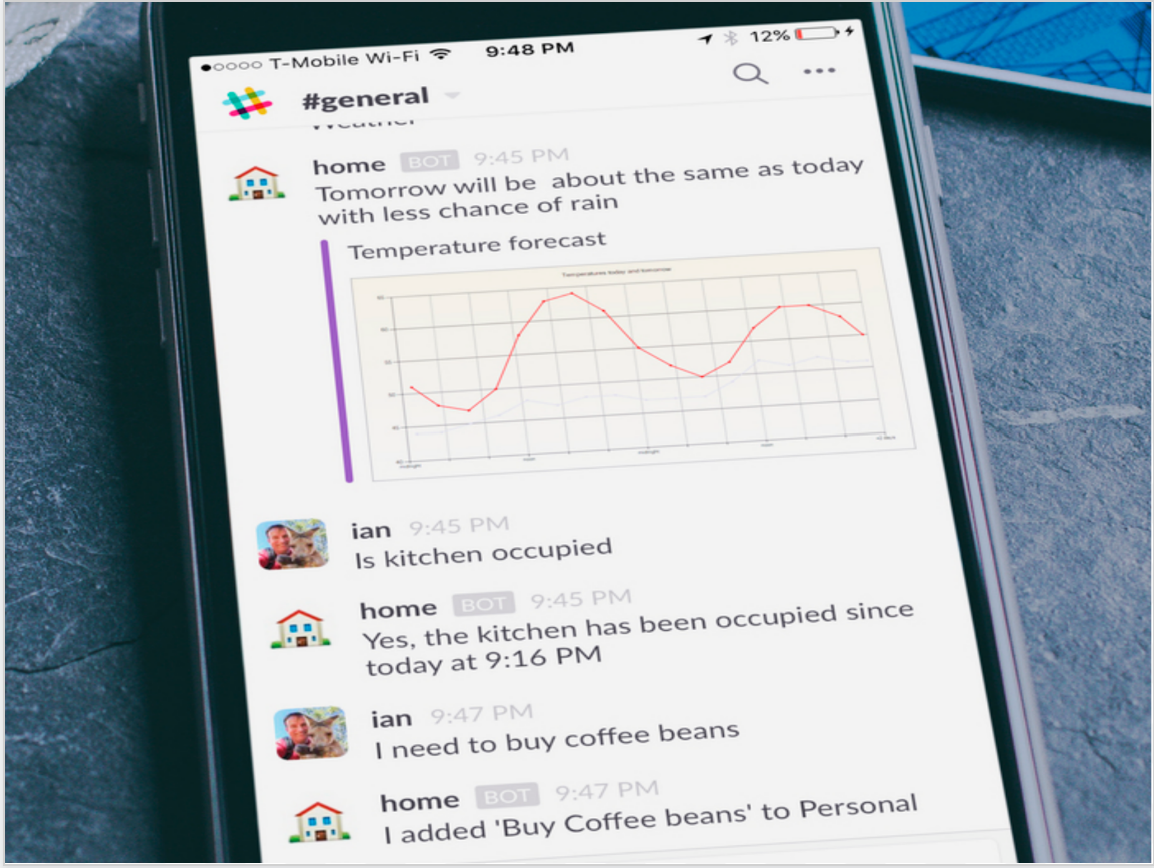
In the USA we are lucky to have the NOAA and their excellent web service that can provide a detailed weather forecast for any location (specified by latitude and longitude). Using this service my home automation system maintains a detailed, regularly updated local weather forecast object which can be queried easily by any other object in the home.
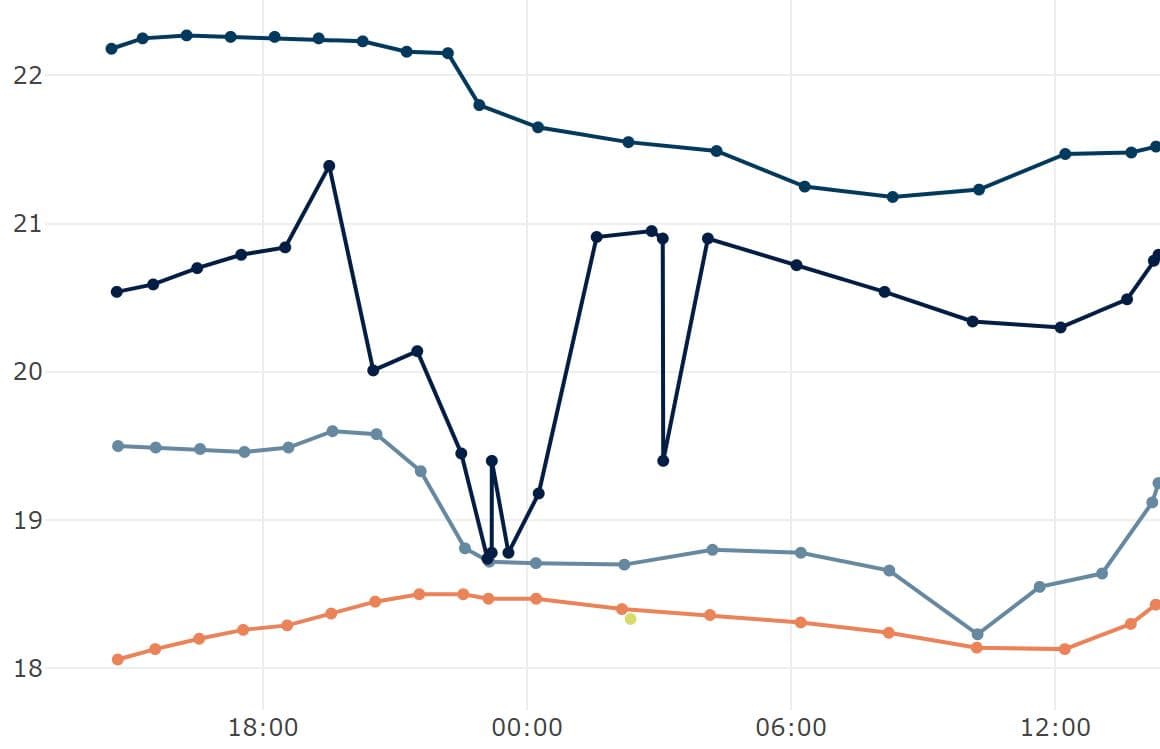
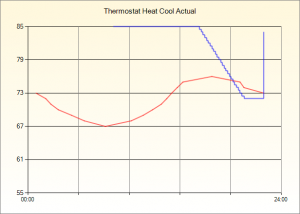
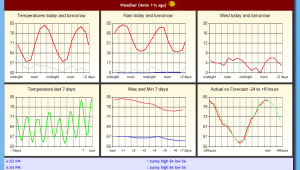
On the weather page you can view all of the forecast information it collects. Of interest the graph in the lower right compares the forecast from NOAA with the actual recorded temperature. In this case you can see just how accurate the forecast has been for the last 24 hours. Normally it runs almost this close but with occasionally there is a significant discrepancy caused by the bizarre 'convergence zone' we live in where Pacific weather patterns split around the Olympic mountains and then recombine over Seattle in somewhat unpredictable ways.
Unlike most home automation systems that have fairly limited if-the-else or table-driven approaches to defining the home logic (often limited to only the current value of any variable), my system has control structures that include statistical functions over temporal data allowing analysis of past data (e.g. average temperature in the last day), or in the case of the weather forecast, future values, e.g. expected temperature one hour from now found using interpolation.
var oneHourFromNow = DateTime.Now.AddHours(1);
double outsideForecastOneHourFromNow = weatherService.ApparentTemperatureHourly.ValueAtTimeWithLinearInterpolation(oneHourFromNow);
This forward looking view at the weather allows for features like garden sprinklers that don't turn on when it's going to rain or HVAC that skips heating cycles when the forecast predicts warm weather later today.
In addition the house is able to issue a detailed local forecast over the speakers when it wakes you up in the morning. Somewhat uniquely the forecast it generates is a relative weather forecast comparing yesterday with today, or today with tomorrow. It might for example say "Today will be much warmer that yesterday" which is a whole lot less words than a normal weather forecast!
The house also has Natural Language Generation (NLG) features which are able to summarize a group of temporal series into distinct ranges allowing it for instance to highlight which the best times of the day are to be outside:-
Monday : excellent from dawn at 5:34 AM until 11:36 AM; hot from 11:36 AM to 2:00 PM; too hot from 2:00 PM to 7:00 PM; hot until sunset at 8:53 PM.
ASP.NET Charts
Incidentally, all of the graphs are rendered using the .NET Charting Control. The graph object is instantiated on the server, all the lines and axes are added to it, then it is serialized and sent over TCP to the web server using WCF. On the web server it is rendered as a PNG file using an Action method that takes size parameters allowing any size graph to be shown on any page. Here's the MVC code that takes the stream from WCF, loads the Chart and then delivers it as a PNG.
Chart chart = new Chart();
chart.Serializer.Load(ms);

MemoryStream ms2 = new MemoryStream();
chart.SaveImage(ms2);

return File(ms2.GetBuffer(), @"image/png");
