Graphing gigabytes of home automation data with tableau
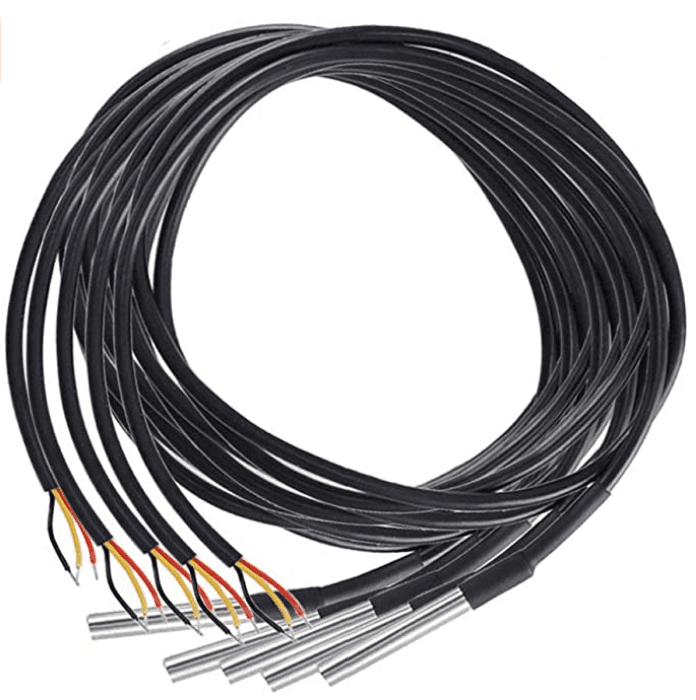
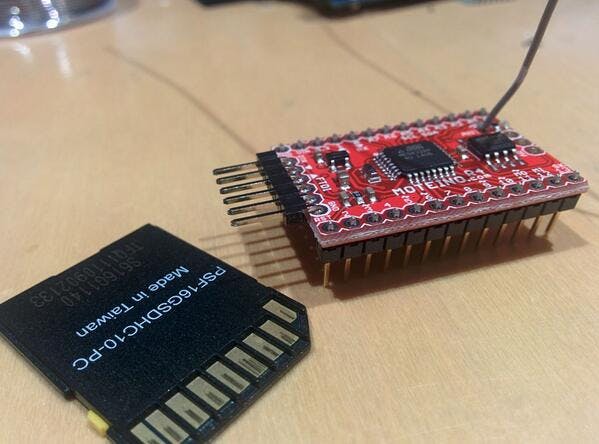
Our house collects a lot of data: over 250 sensors under the floors, on the walls, above the doors, ... are each being triggered many times a day. All this data and any derived data (like room occupancy) is stored in a MongoDB database that just keeps growing. Last time I checked it was over 150GB.
In an attempt to get a better understanding of that data and to come up with ideas for improved features I recently set about visualizing more of it. To do that I'm using Tableau.
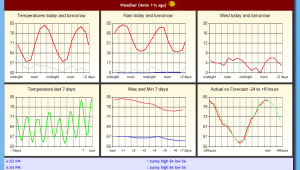
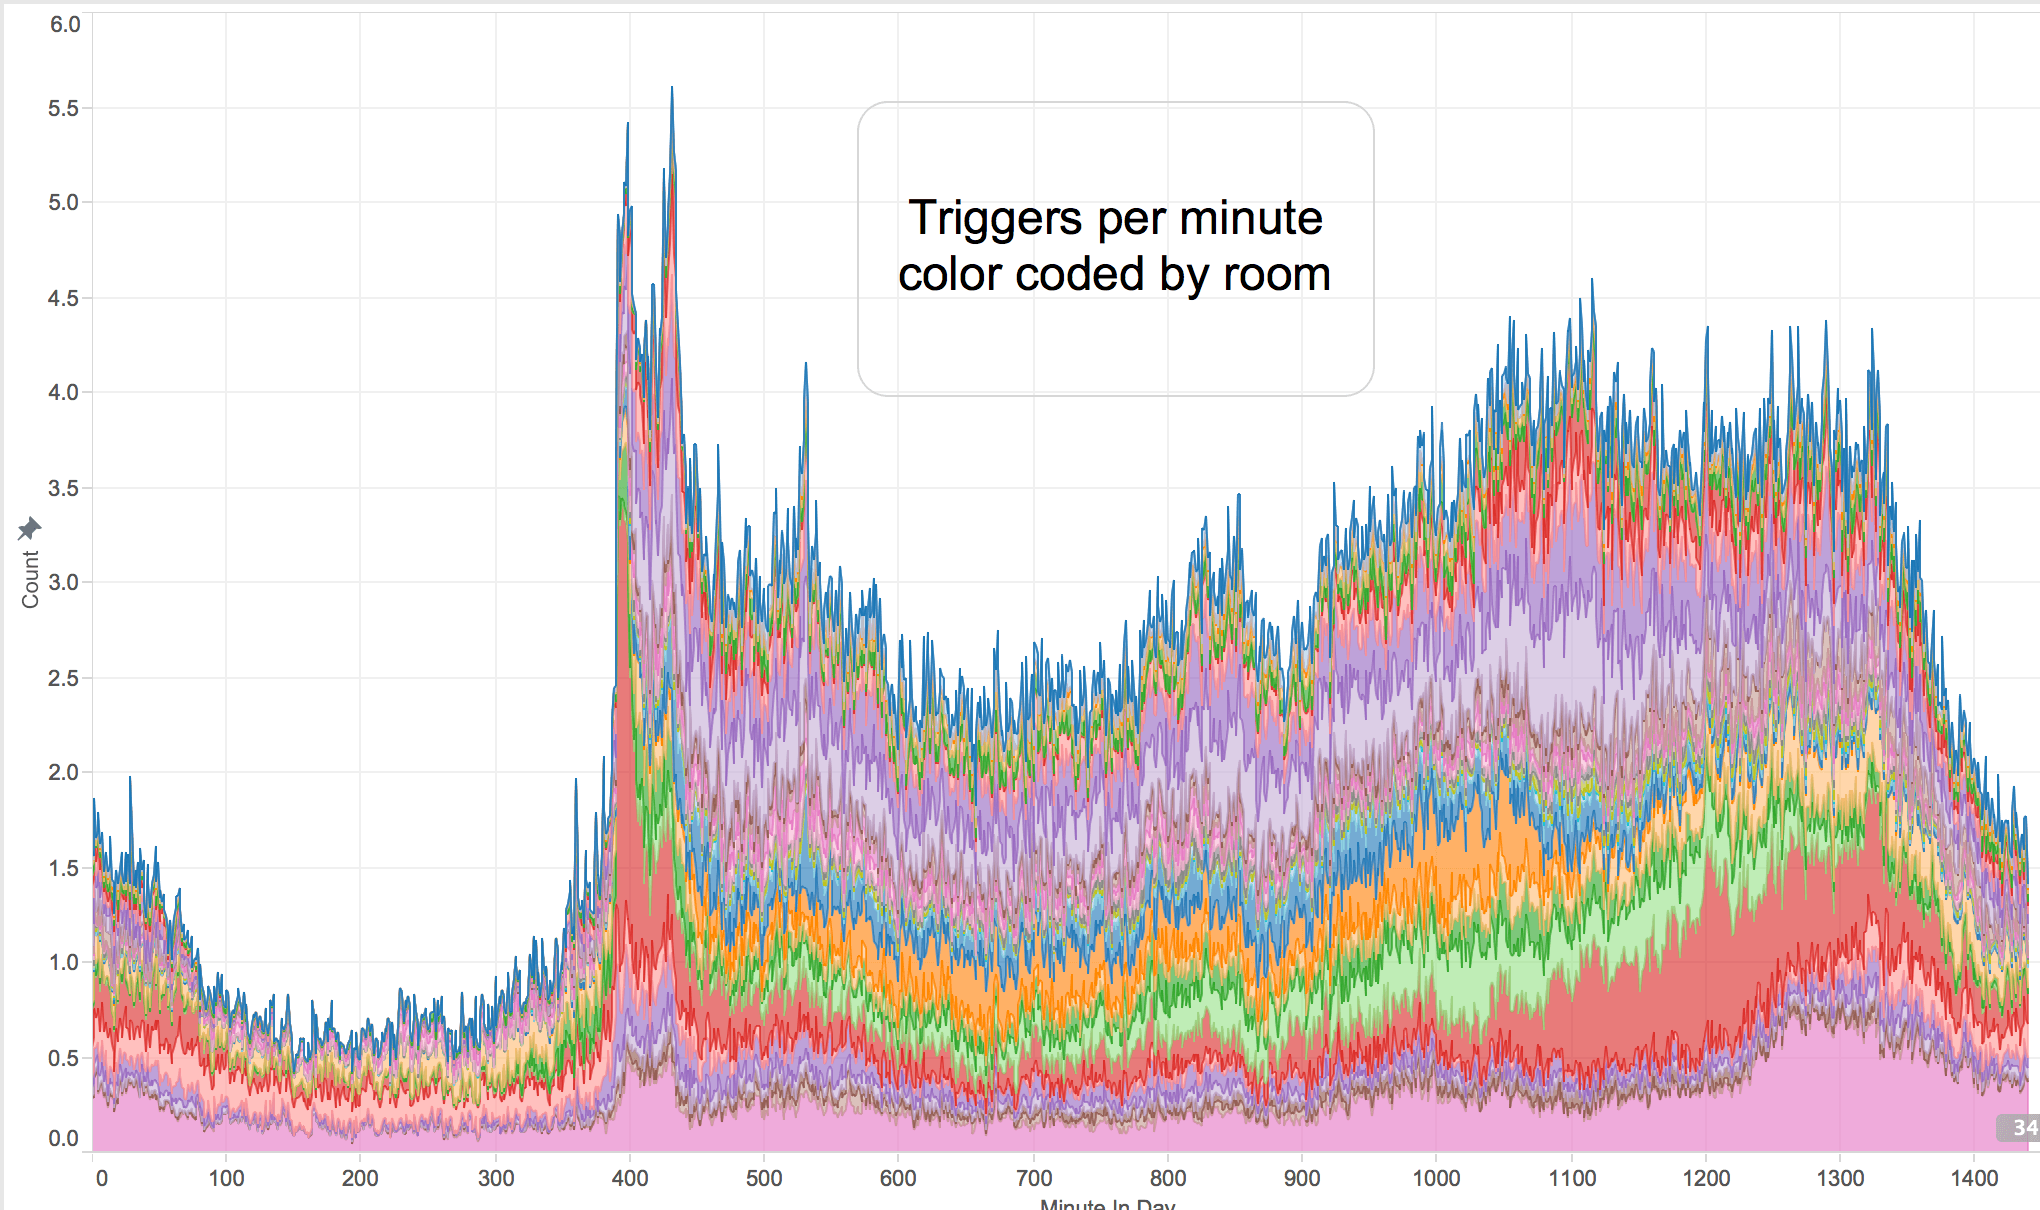
The first chart here shows activity in terms of trigger events received for each room of the house. You can clearly see night time when the rate drops off, a massive peak in the morning, quieting down during the middle of the day and then rising into the evening. You can also see some of the variation by room as to which rooms are used at different times of day. You might wonder why there is still so much activity in the night, well, the motion sensors in the bedrooms are perhaps too sensitive and turning over is enough to trigger them.
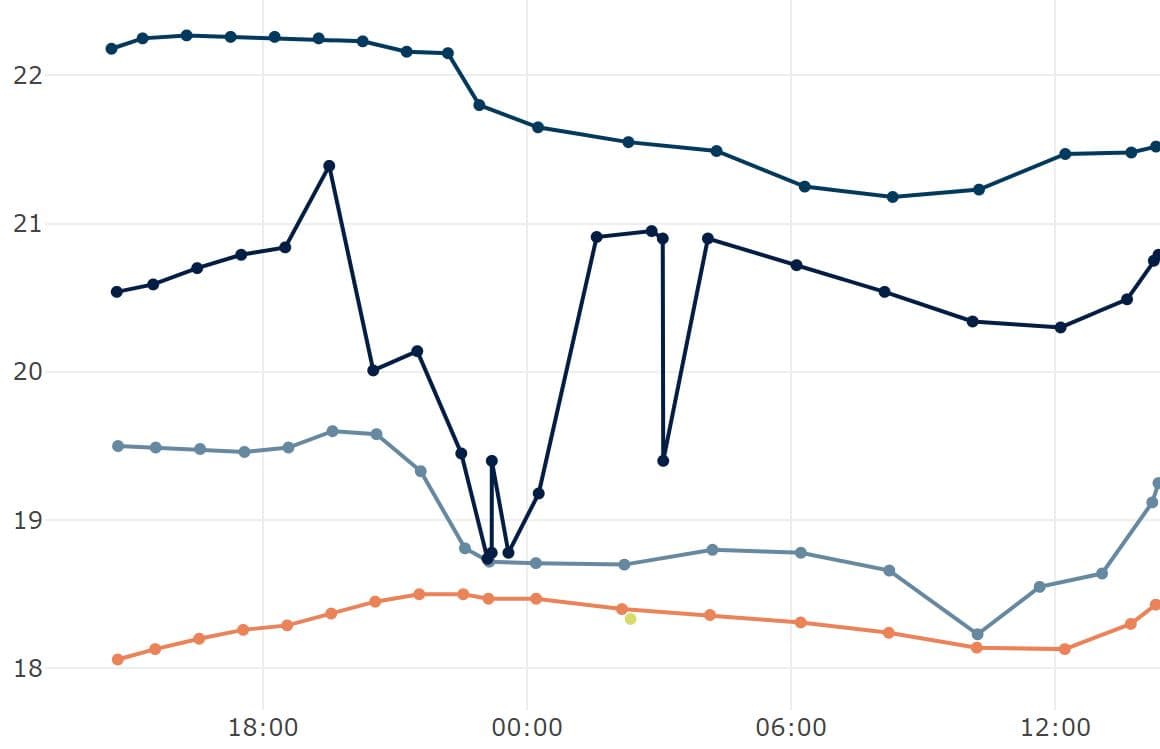
The second chart here shows the calculated occupancy for each room. The upper purple line is the kitchen - the most heavily occupied room in the house throughout the day. The green line is a bedroom, occupied during the night when most other rooms are not occupied. This graph shows the percentage chance that a room is occupied at any given time, possibly a useful value for future predictive capabilities.
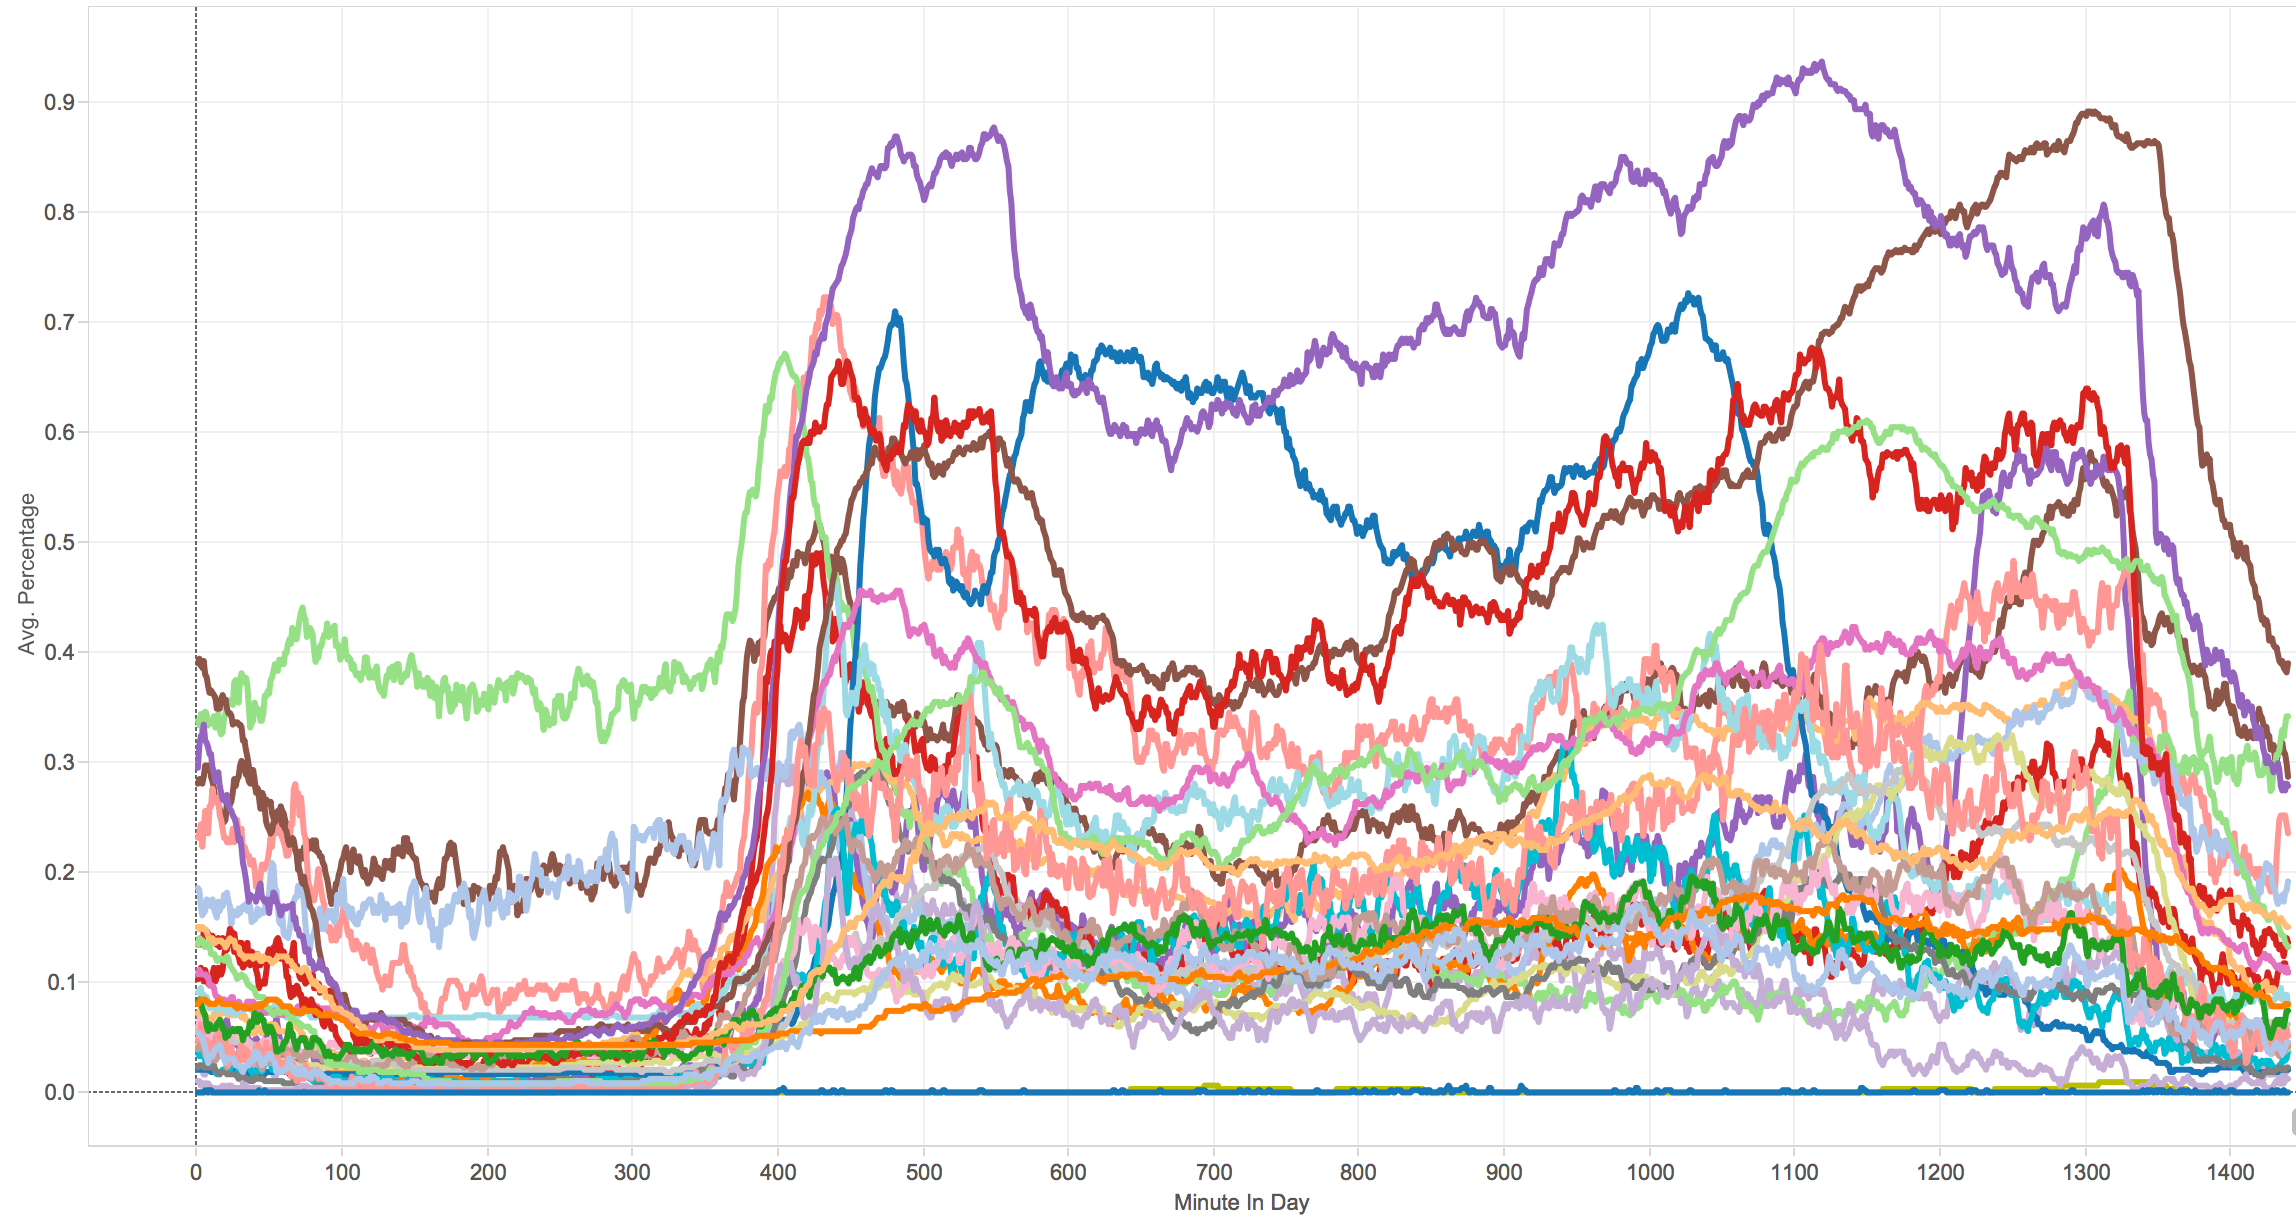
Occupancy by room by time of day
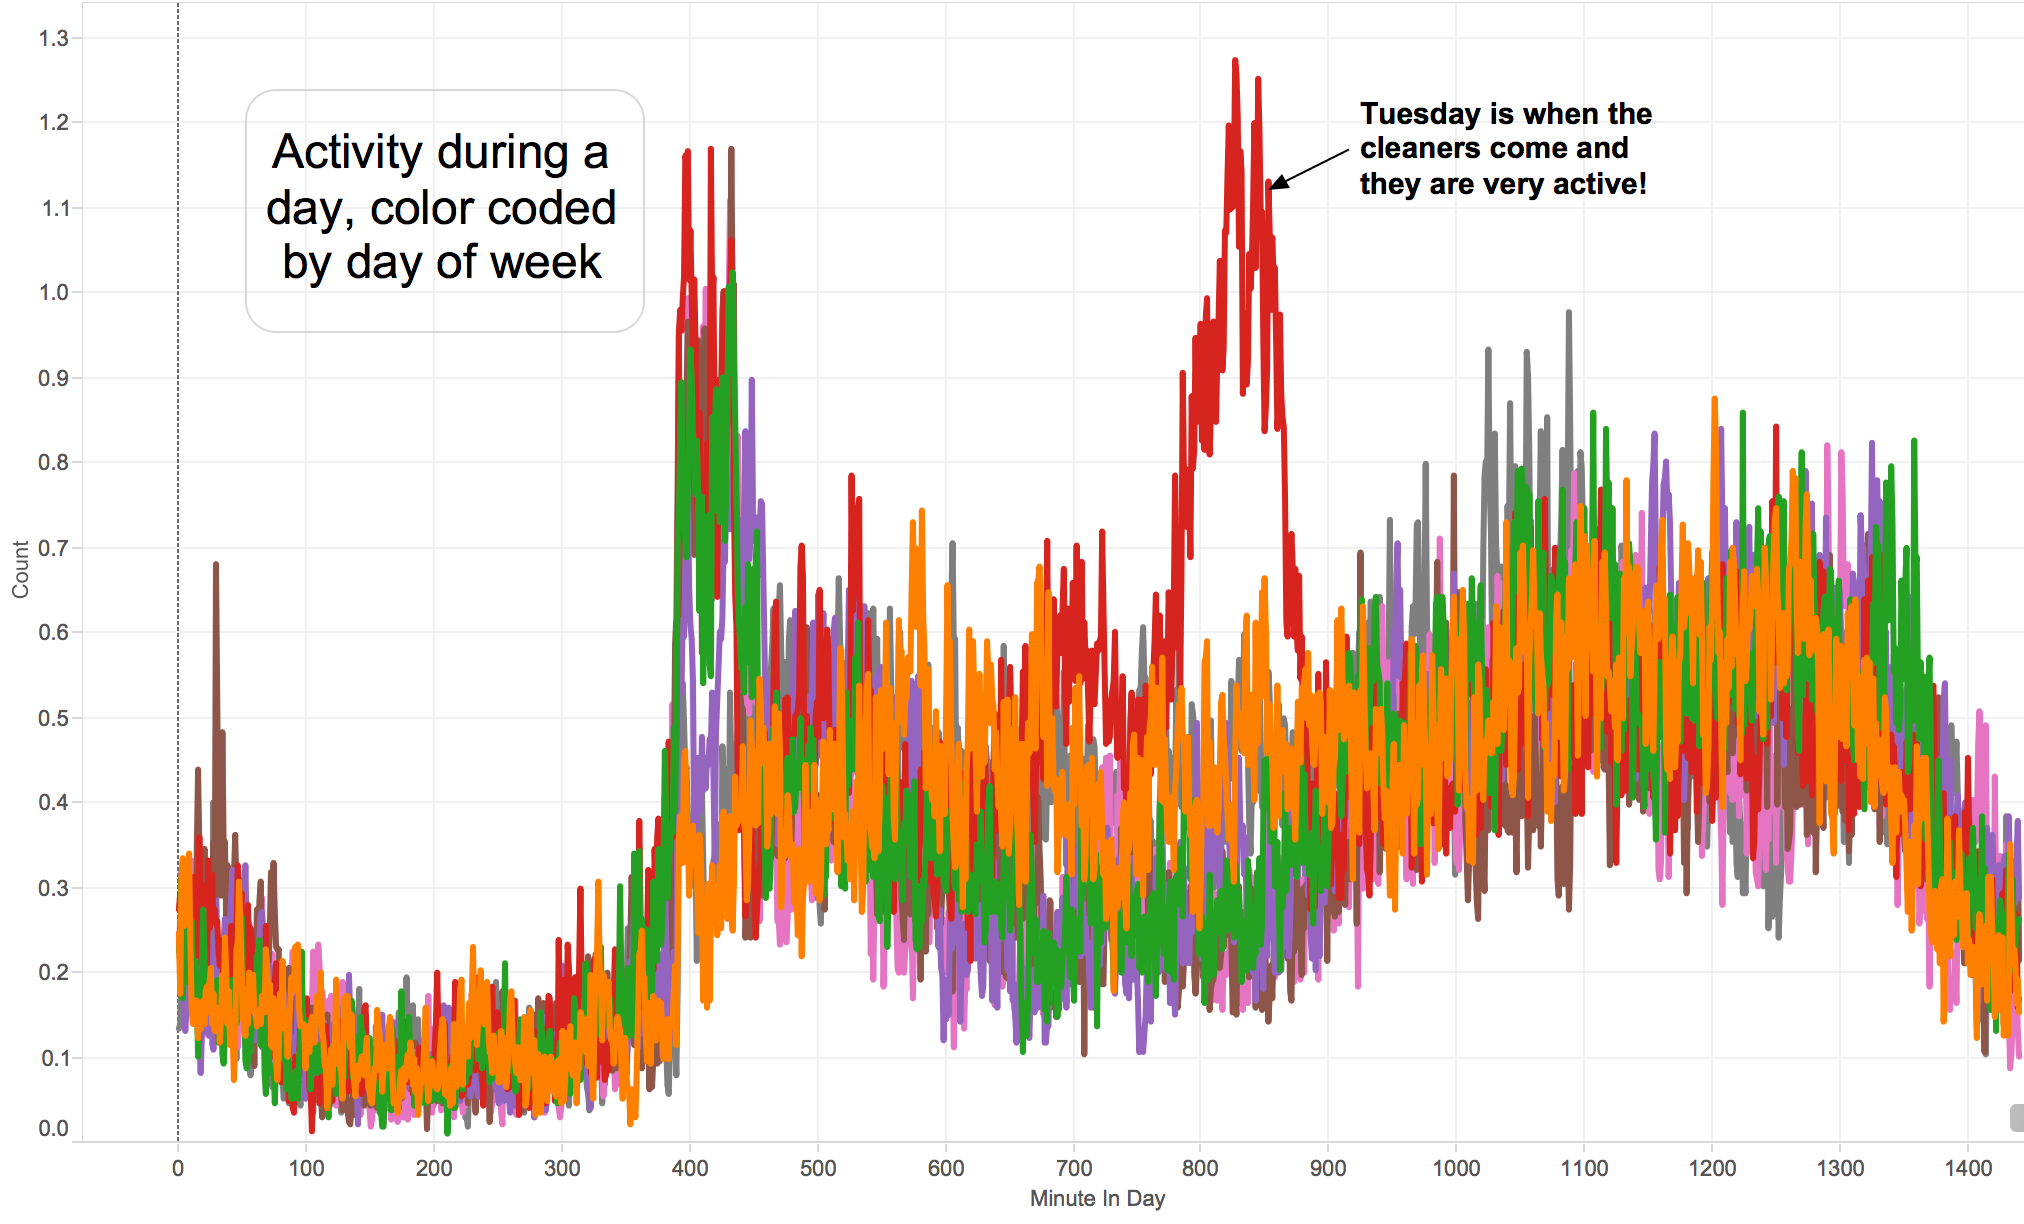
The third chart shows activity color-coded by day. Weekends have a different shape to week days (e.g. orange line) but one day stands out from all the others: Tuesday. That's when our house is cleaned and for a brief time there's lots of activity all over the house pushing triggers per minute up to their highest value in the week.
The shape of each day can also be seen in this plot of activity by minute of the week color coded for day and showing just activity on the first floor of the house:
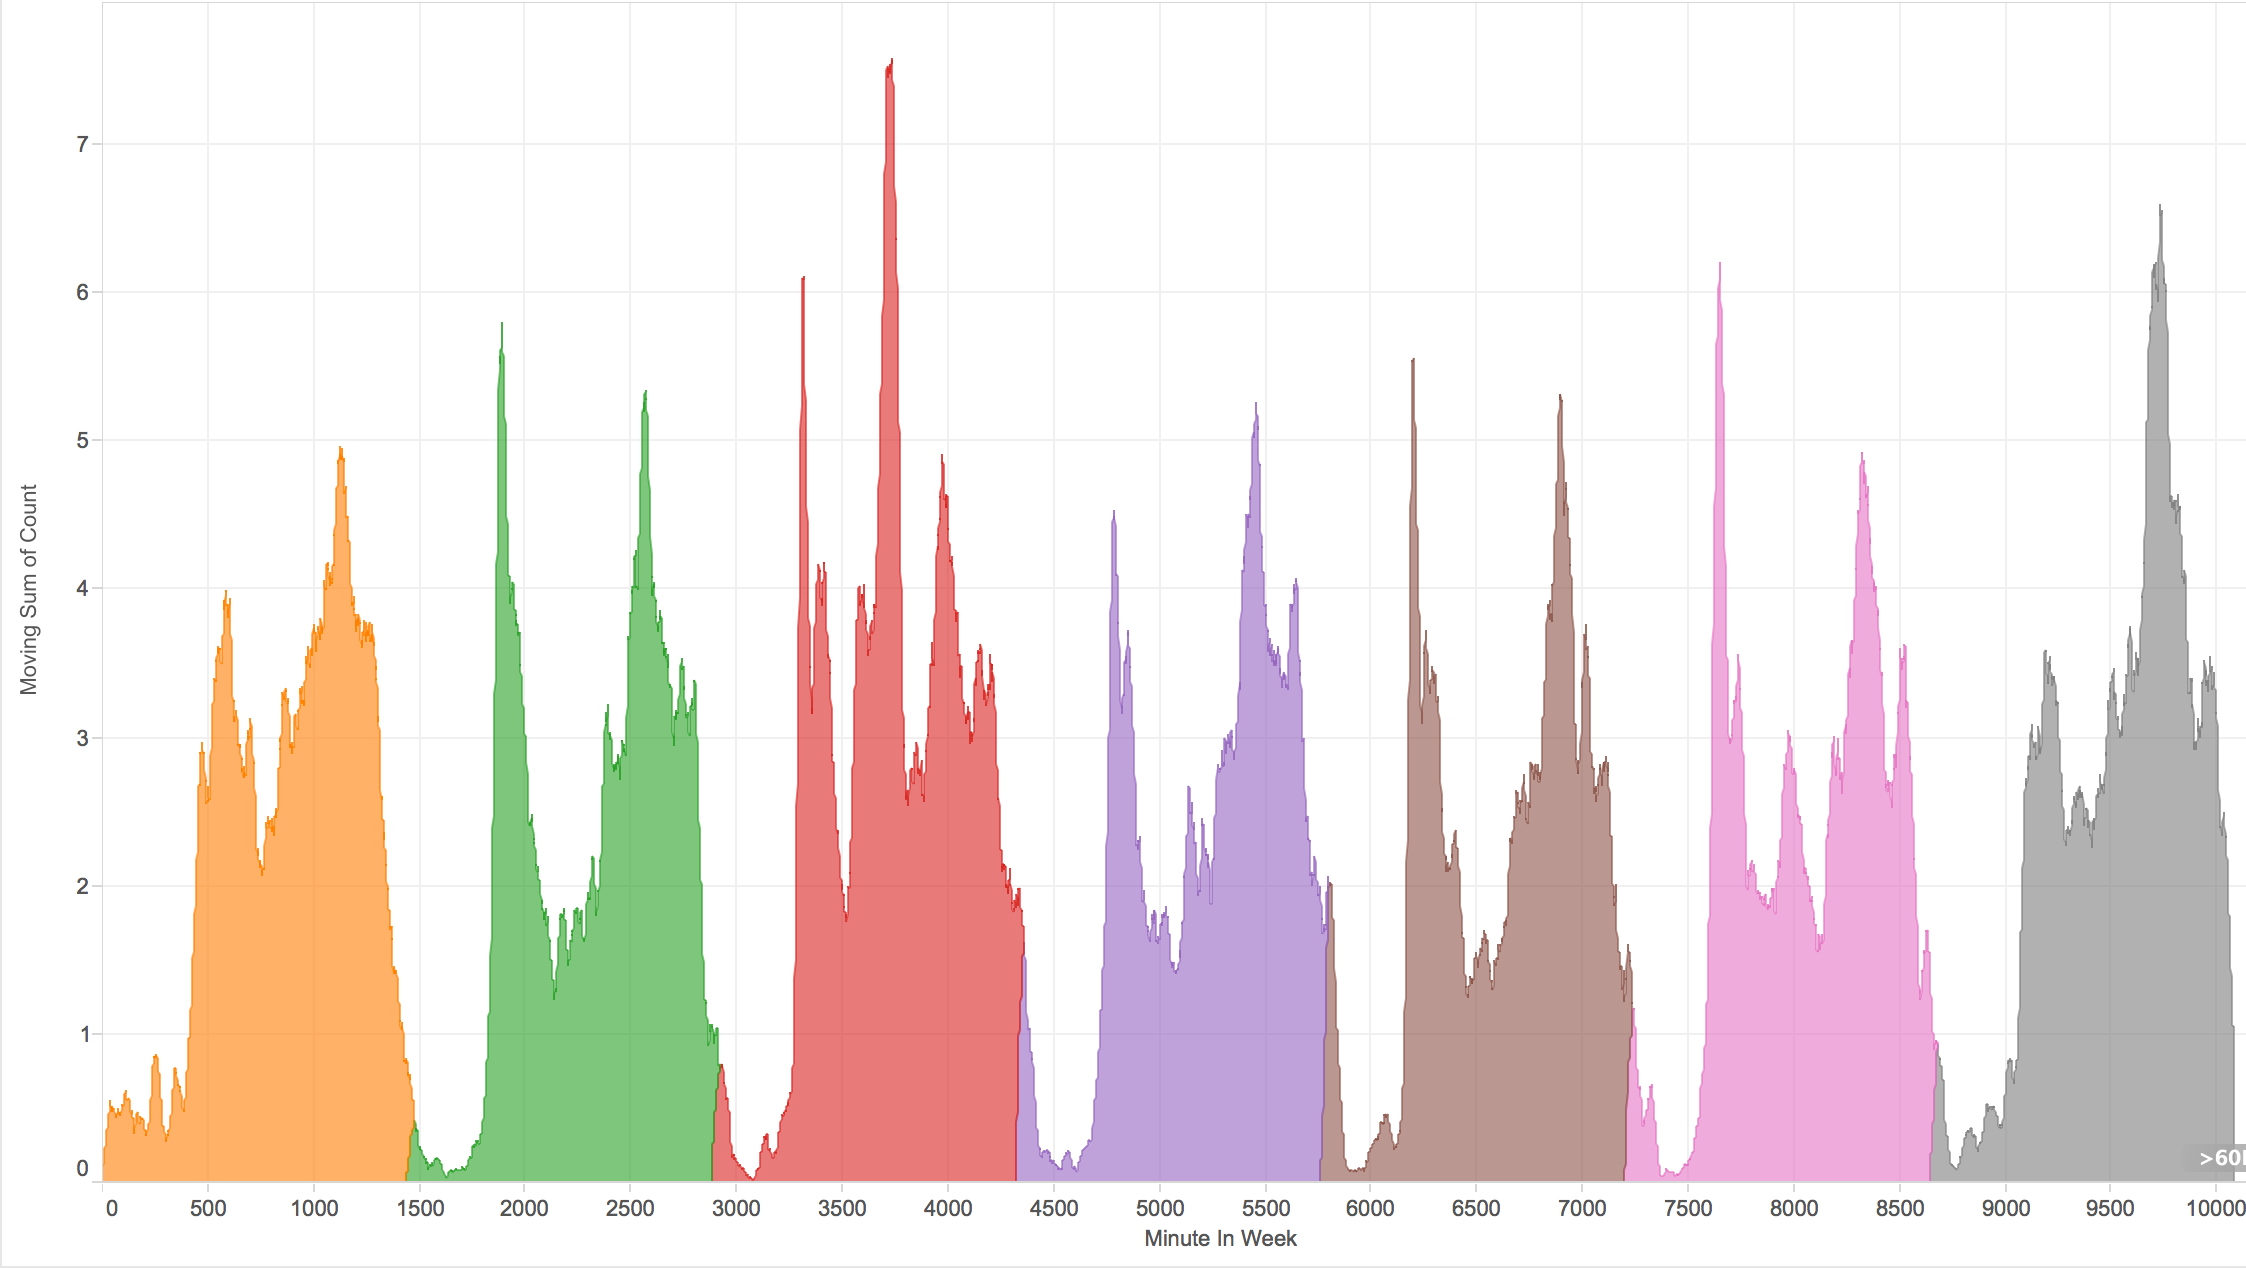
The shape of each day