The Blog of Ian Mercer.

N-Gram Analysis of Sensor Events in Home Automation

Cover Image for N-Gram Analysis of Sensor Events in Home Automation

This week I decided to add some visualizations of the ever growing database of sensor data my house is accumulating. The first visualization I attempted was a N-gram analysis (actually just a digram, n=2). I created a quick autocomplete API method for picking sensors, an Angular.js form for the UI and another API that given a pair of sensors, scans the entire database to build a new collection containing delta values from when one sensor is triggered to when the next is triggered. The API returns a null collection until the background scan has completed so the UI can display a working indicator and finally when the results are available it can show the graph. For the graph itself I used D3.js which provides methods to aggregate frequency values into buckets (histogram) and then I display that histogram as a line using one of the many interpolations offered.

Here are some of the interesting graphs this technique has produced.

N-Gram Home Automation 1

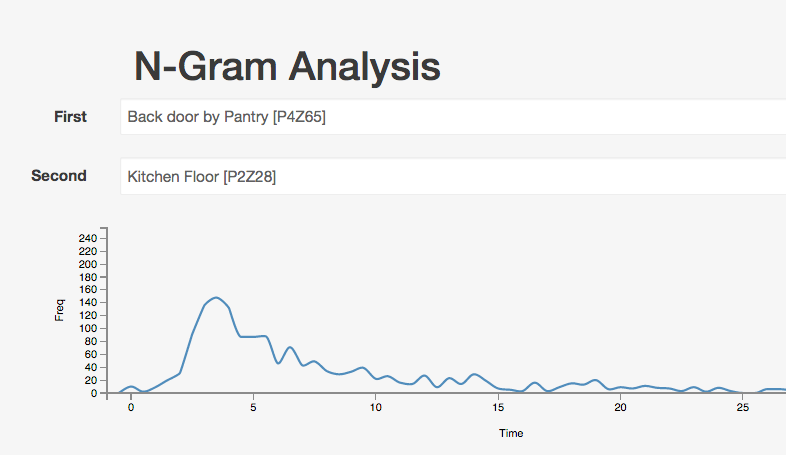
This one shows how long it takes someone to get from the back door into the kitchen. Just a few seconds typically.

N-Gram Home Automation 2

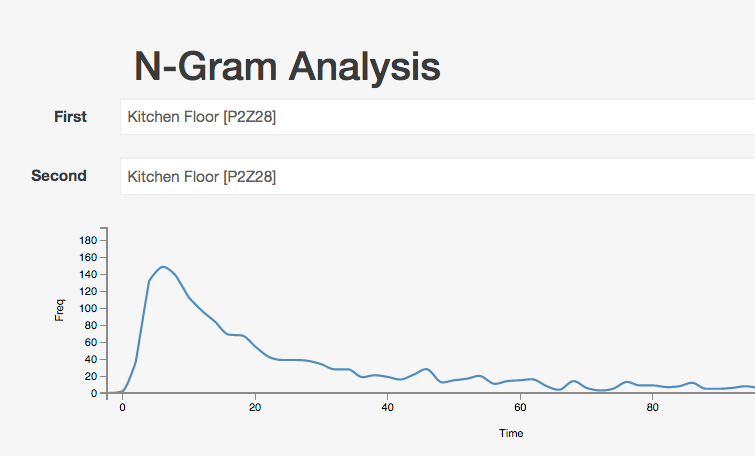
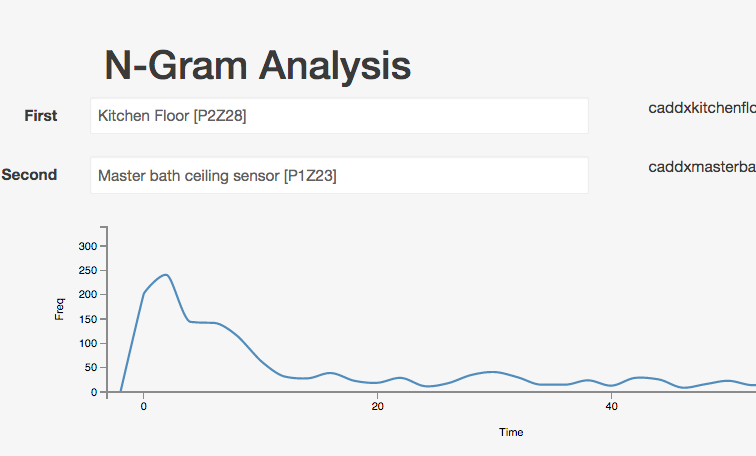
This one shows the gap between repeated triggers of the kitchen floor.

N-Gram Home Automation 3

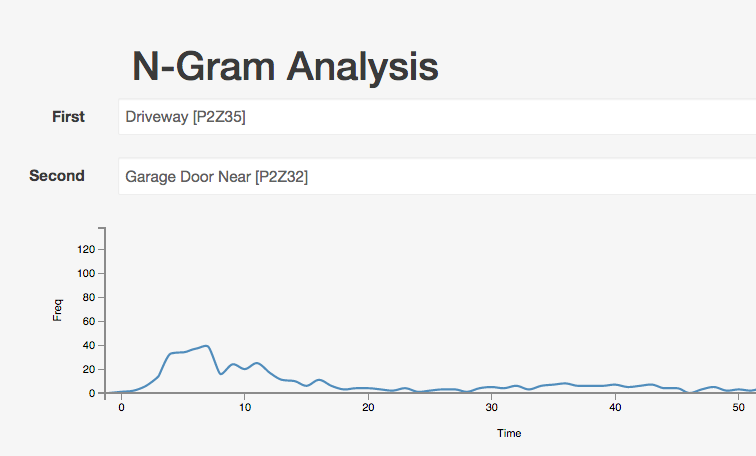
It takes about 8 seconds from a car passing through the gate until the garage door starts opening. But it's nowhere near as smooth a curve and it has a much longer tail.

N-Gram Home Automation 4

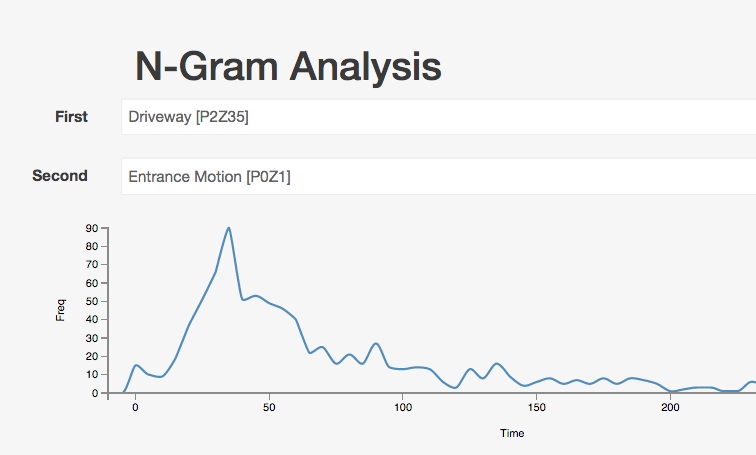
When we have visitors or deliveries they come to the front door where there is a motion sensors. It takes about 35 seconds from a car passing through the gate until motion is detected on the front door step.

N-Gram Home Automation 5

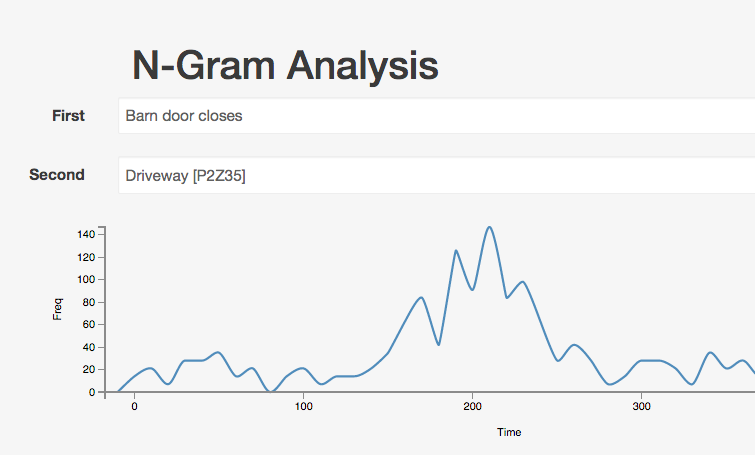
It takes about 3 minutes to drive a car around the block from the barn to the house. The three spikes around this value might represent the three different drivers in the family and the way they drive, or there could be some other reason why the journey time varies this way (assuming they are even statistically significant - which I haven't checked).

NGram Unrelated Events

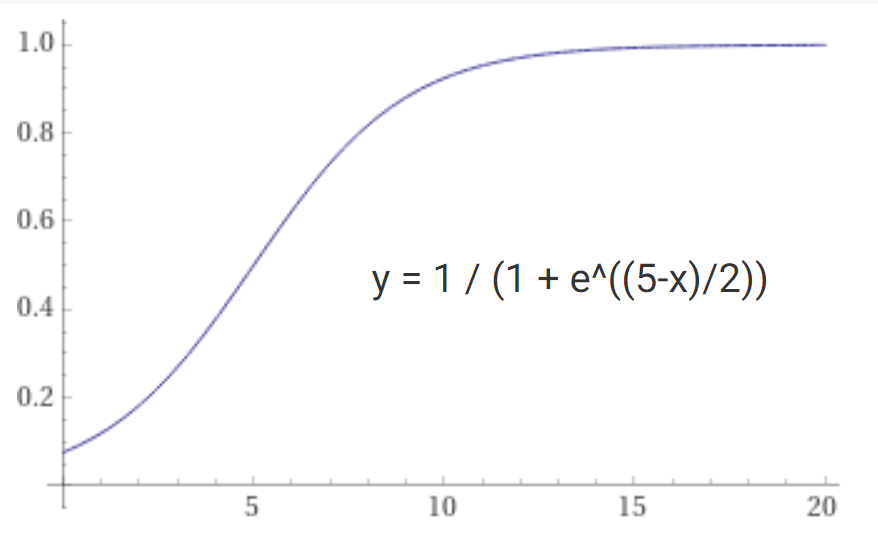
One challenge in interpreting these results is that even two unrelated sensors have a nice exponential graph, although the peak around zero seconds is a clear indication that these are not related since they are impossibly close in time.

Next Steps

These graphs have immediately given me a way to fine tune some of the it-this-and-then-that-within-30-seconds type of logic I sometimes use. I now have an accurate understanding of the likely distribution of times between two events.

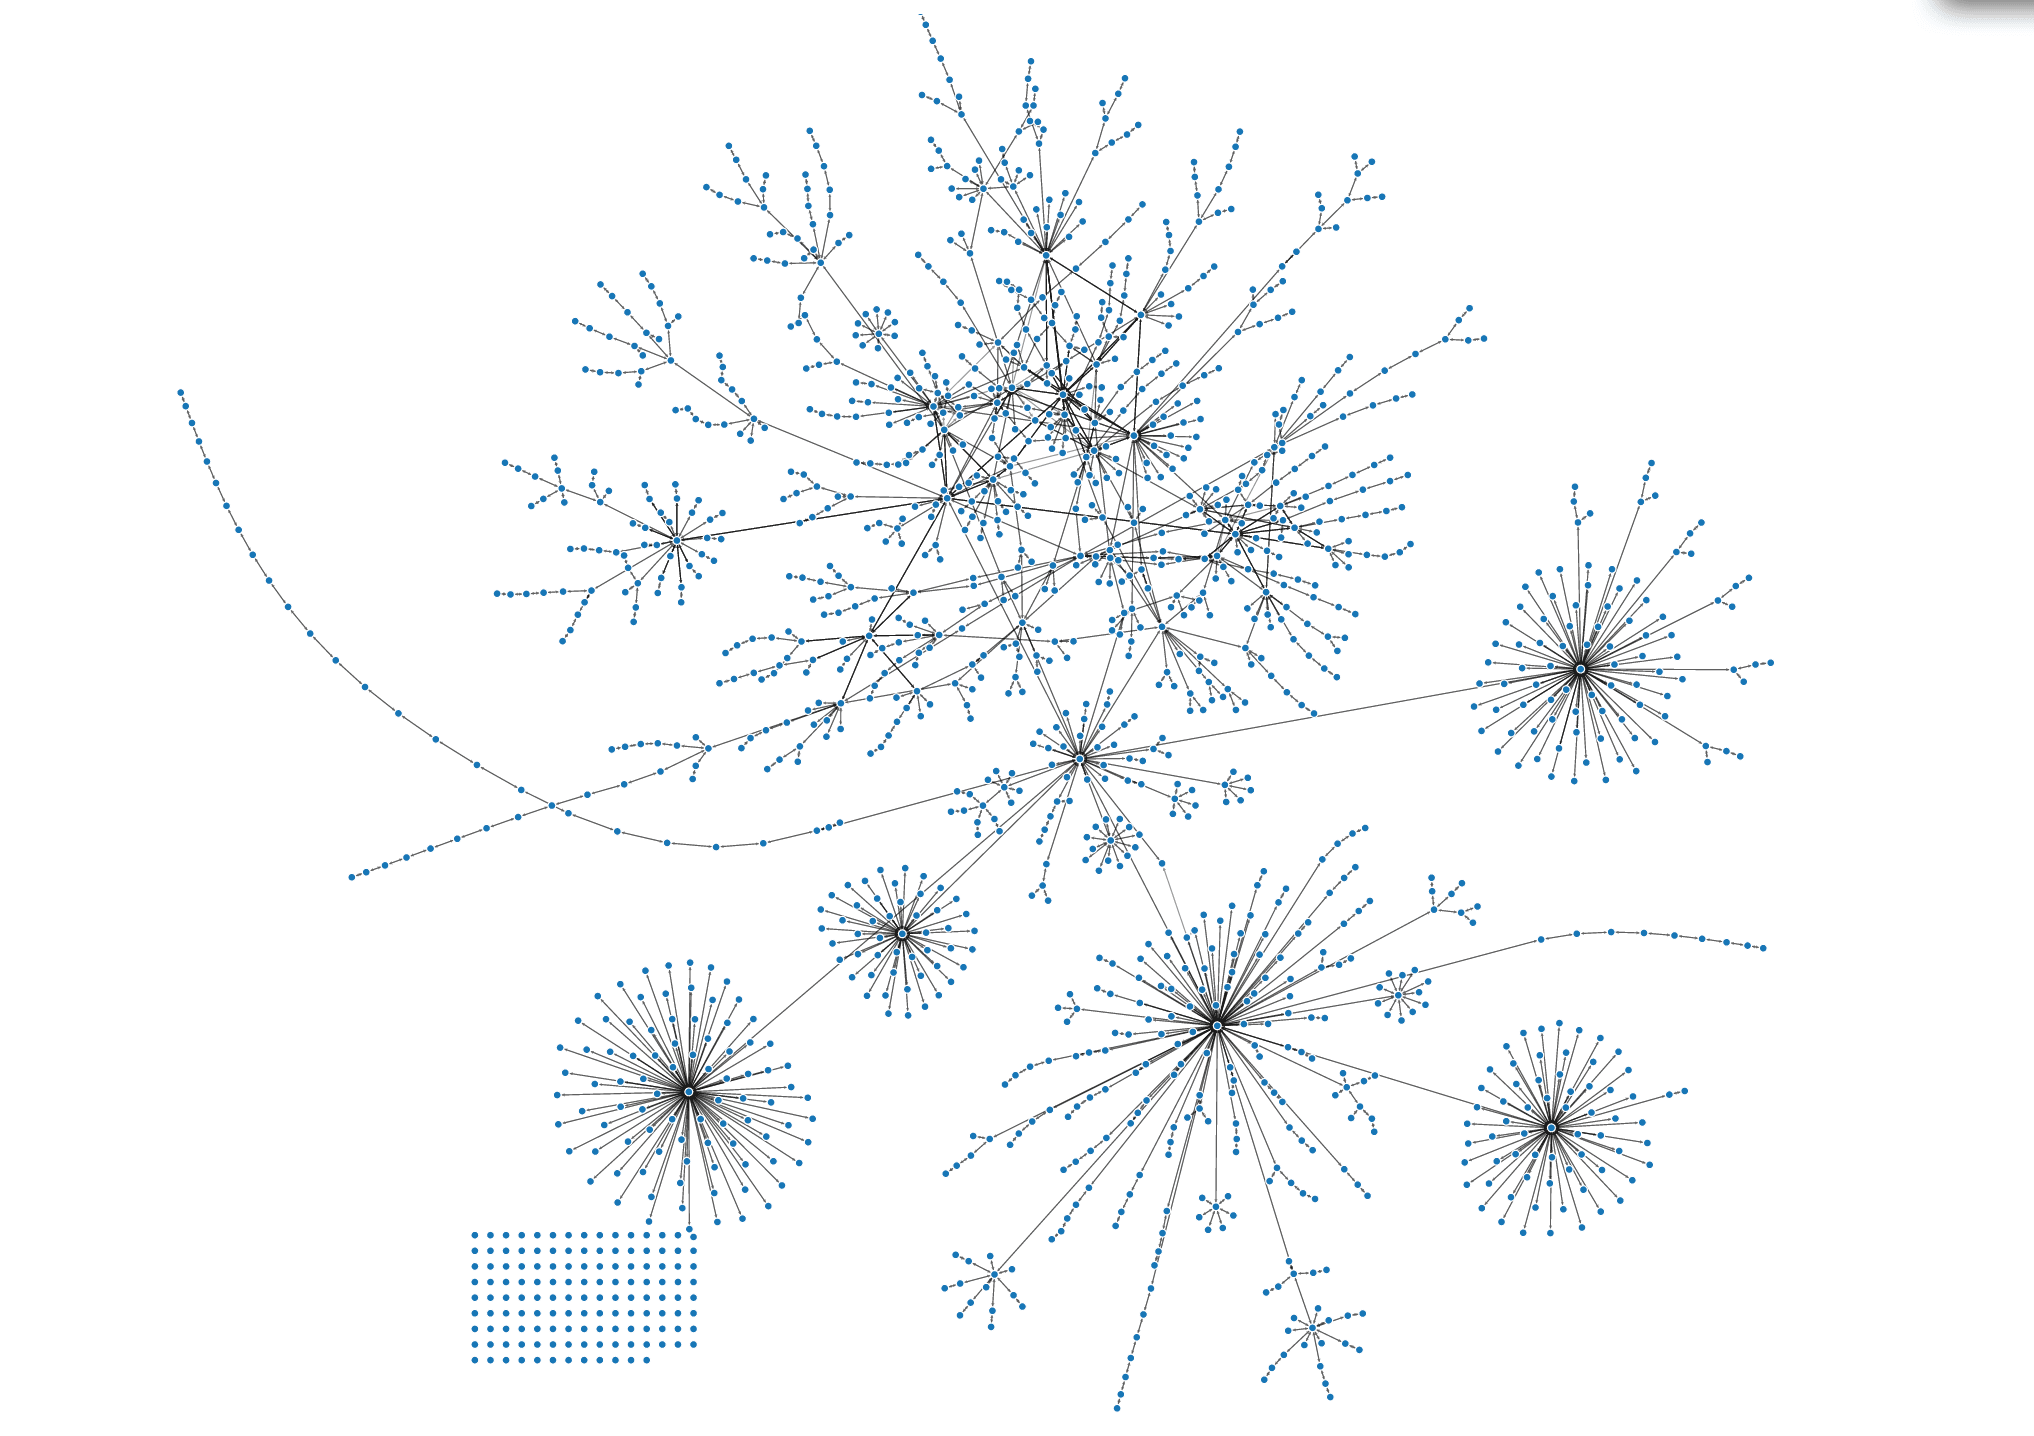
Given a sufficiently dense network of sensors it should be possible to deduce the geometry of the house without being given any information about where the sensors are located.

By feeding all of these Digrams back into the system as sensors I can start looking for interesting 3-grams and 4-grams.

I'm also considering having the software scan all of the digrams to decide which are 'interesting' so it can present a list of suggested sensor pairs, e.g. "Is living room floor then front door an interesting event?" Using the graph of the house I can get the system to compute all possible 2-Grams that are physically likely, i.e. the sensors are in rooms that are connected to each other within a reasonable distance. The graph will, once again prove to be a very useful representation of the house.

Related Stories

Cover Image for Time Series Data Compression

Time Series Data Compression

This new technique to compress the time series data collected by my home automation system seems to be working really well.

Ian Mercer
Ian Mercer
Cover Image for Home Automation

Home Automation

I've been working on home automation for over 15 years and I'm close to achieving my goal which is a house that understands where everyone is at all times, can predict where you are going next and can control lighting, heating and other systems without you having to do or say anything. That's a true "smart home".

Ian Mercer
Ian Mercer
Cover Image for Home Automation Sensors

Home Automation Sensors

An overview of the many sensors I've experimented with for home automation including my favorite under-floor strain gauge, through all the usual PIR, beam and contact sensors to some more esoteric devices like an 8x8 thermal camera.

Ian Mercer
Ian Mercer
Cover Image for Collinearity test for sensor data compression

Collinearity test for sensor data compression

One way to reduce the volume of sensor data is to remove redundant points. In a system with timestamped data recorded on an irregular interval we can achieve this by removing co-linear points.

Ian Mercer
Ian Mercer
Cover Image for Event blocks

Event blocks

Home automation systems need to respond to events in the real world. Sometimes it's an analog value, sometimes it's binary, rarely is it clean and not susceptible to problems. Let's discuss some of the ways to convert these inputs into actions.

Ian Mercer
Ian Mercer
Cover Image for Logistic function - convert values to probabilities

Logistic function - convert values to probabilities

Another super useful function for handling sensor data and converting to probabilities is the logistic function 1/(1+e^-x). Using this you can easily map values onto a 0.0-1.0 probability range.

Ian Mercer
Ian Mercer
Cover Image for ATAN curve for probabilities

ATAN curve for probabilities

In a home automation system we often want to convert a measurement into a probability. The ATAN curve is one of my favorite curves for this as it's easy to map overything onto a 0.0-1.0 range.

Ian Mercer
Ian Mercer
Cover Image for Probabilistic Home Automation

Probabilistic Home Automation

A probabilistic approach to home automation models the probability that each room is occupied and how many people are in that room.

Ian Mercer
Ian Mercer
Cover Image for Multiple hypothesis tracking

Multiple hypothesis tracking

A statistical approach to understanding which rooms are occupied in a smart house

Ian Mercer
Ian Mercer
Cover Image for A state machine for lighting control

A state machine for lighting control

An if-this-then-that style rules machine is insufficient for lighting control. This state machine accomplishes 90% of the correct behavior for a light that is controlled automatically and manually in a home automation system.

Ian Mercer
Ian Mercer
Cover Image for Home Automation States

Home Automation States

Understanding the many different 'states' a house can have is critical to creating great home automation

Ian Mercer
Ian Mercer
Cover Image for Graphing gigabytes of home automation data with tableau

Graphing gigabytes of home automation data with tableau

Some interesting charts from the gigabytes of data my home automation system produces

Ian Mercer
Ian Mercer
Cover Image for iBeacons for Home Automation

iBeacons for Home Automation

My investigations into using iBeacons for home automation

Ian Mercer
Ian Mercer
Cover Image for iBeacon meetup in Seattle - January 2015

iBeacon meetup in Seattle - January 2015

My notes on the iBeacon meetup in Seattle held in January 2015

Ian Mercer
Ian Mercer
Cover Image for Home Automation Systems as a Graph

Home Automation Systems as a Graph

Using nodes and links to represent a home and all the devices in it

Ian Mercer
Ian Mercer
Cover Image for Xamarin Forms Application For Home Automation

Xamarin Forms Application For Home Automation

Building a Xamarin Forms application to control my home automation system

Ian Mercer
Ian Mercer
Cover Image for The Internet of Hubs (and things)

The Internet of Hubs (and things)

Maybe it should be called the Internet of Hubs instead

Ian Mercer
Ian Mercer
Cover Image for Showing home status with just a single RGB LED

Showing home status with just a single RGB LED

Multicolored LEDs can convey a lot of information in a small space

Ian Mercer
Ian Mercer
Cover Image for A wireless sensor network using Moteino boards

A wireless sensor network using Moteino boards

The diminutive Arduino boards include a powerful transmitter/receiver

Ian Mercer
Ian Mercer
Cover Image for The home as a user interface

The home as a user interface

Ian Mercer
Ian Mercer

A RESTful API for sensor data

POSTing data to a home automation system from Arduino devices

Ian Mercer
Ian Mercer
Cover Image for The Internet of Boilers

The Internet of Boilers

An experiment to measure every aspect of an HVAC / boiler system

Ian Mercer
Ian Mercer

VariableWithHistory - making persistence invisible, making history visible

A novel approach to adding history to variables in a programming language

Ian Mercer
Ian Mercer
Cover Image for A Quantified House - My Talk to the Seattle Quantified Self Meetup

A Quantified House - My Talk to the Seattle Quantified Self Meetup

My talk to the Seattle Quantified Self meetup

Ian Mercer
Ian Mercer

Integrating an Android phone into my home automation system

Some new features for my home automation using an Android phone

Ian Mercer
Ian Mercer
Cover Image for The Internet of Dogs

The Internet of Dogs

Connecting our dog into the home automation

Ian Mercer
Ian Mercer
Cover Image for GreenGoose Review

GreenGoose Review

A review of the now defunct GreenGoose sensor system

Ian Mercer
Ian Mercer
Cover Image for Home power meters revisited

Home power meters revisited

Ian Mercer
Ian Mercer
Cover Image for Home Automation Calendar Integration

Home Automation Calendar Integration

Ian Mercer
Ian Mercer

Smart home energy savings - update for 2010

Ian Mercer
Ian Mercer
Cover Image for A smart power strip

A smart power strip

Ian Mercer
Ian Mercer
Cover Image for What does a Smart House do at Halloween?

What does a Smart House do at Halloween?

My favorite home automation features for Halloween

Ian Mercer
Ian Mercer
Cover Image for Home Automation Top Features

Home Automation Top Features

Ian Mercer
Ian Mercer
Cover Image for Weather Forecasting for Home Automation

Weather Forecasting for Home Automation

Ian Mercer
Ian Mercer
Cover Image for How can I tell if my house is smart?

How can I tell if my house is smart?

Ian Mercer
Ian Mercer

Home Automation Block Diagram

Ian Mercer
Ian Mercer

World's Smartest House Demonstration

Ian Mercer
Ian Mercer

Future proof your home with a new conduit system?

Running conduit can be expensive but maybe you don't need one to every room

Ian Mercer
Ian Mercer
Cover Image for New Home Automation Server

New Home Automation Server

Ian Mercer
Ian Mercer
Cover Image for World's Smartest House

World's Smartest House

Over 15 years of experimentation with home automation

Ian Mercer
Ian Mercer
Cover Image for World's Smartest House Videos

World's Smartest House Videos

A collection of videos about my smart home efforts

Ian Mercer
Ian Mercer