The Internet of Boilers
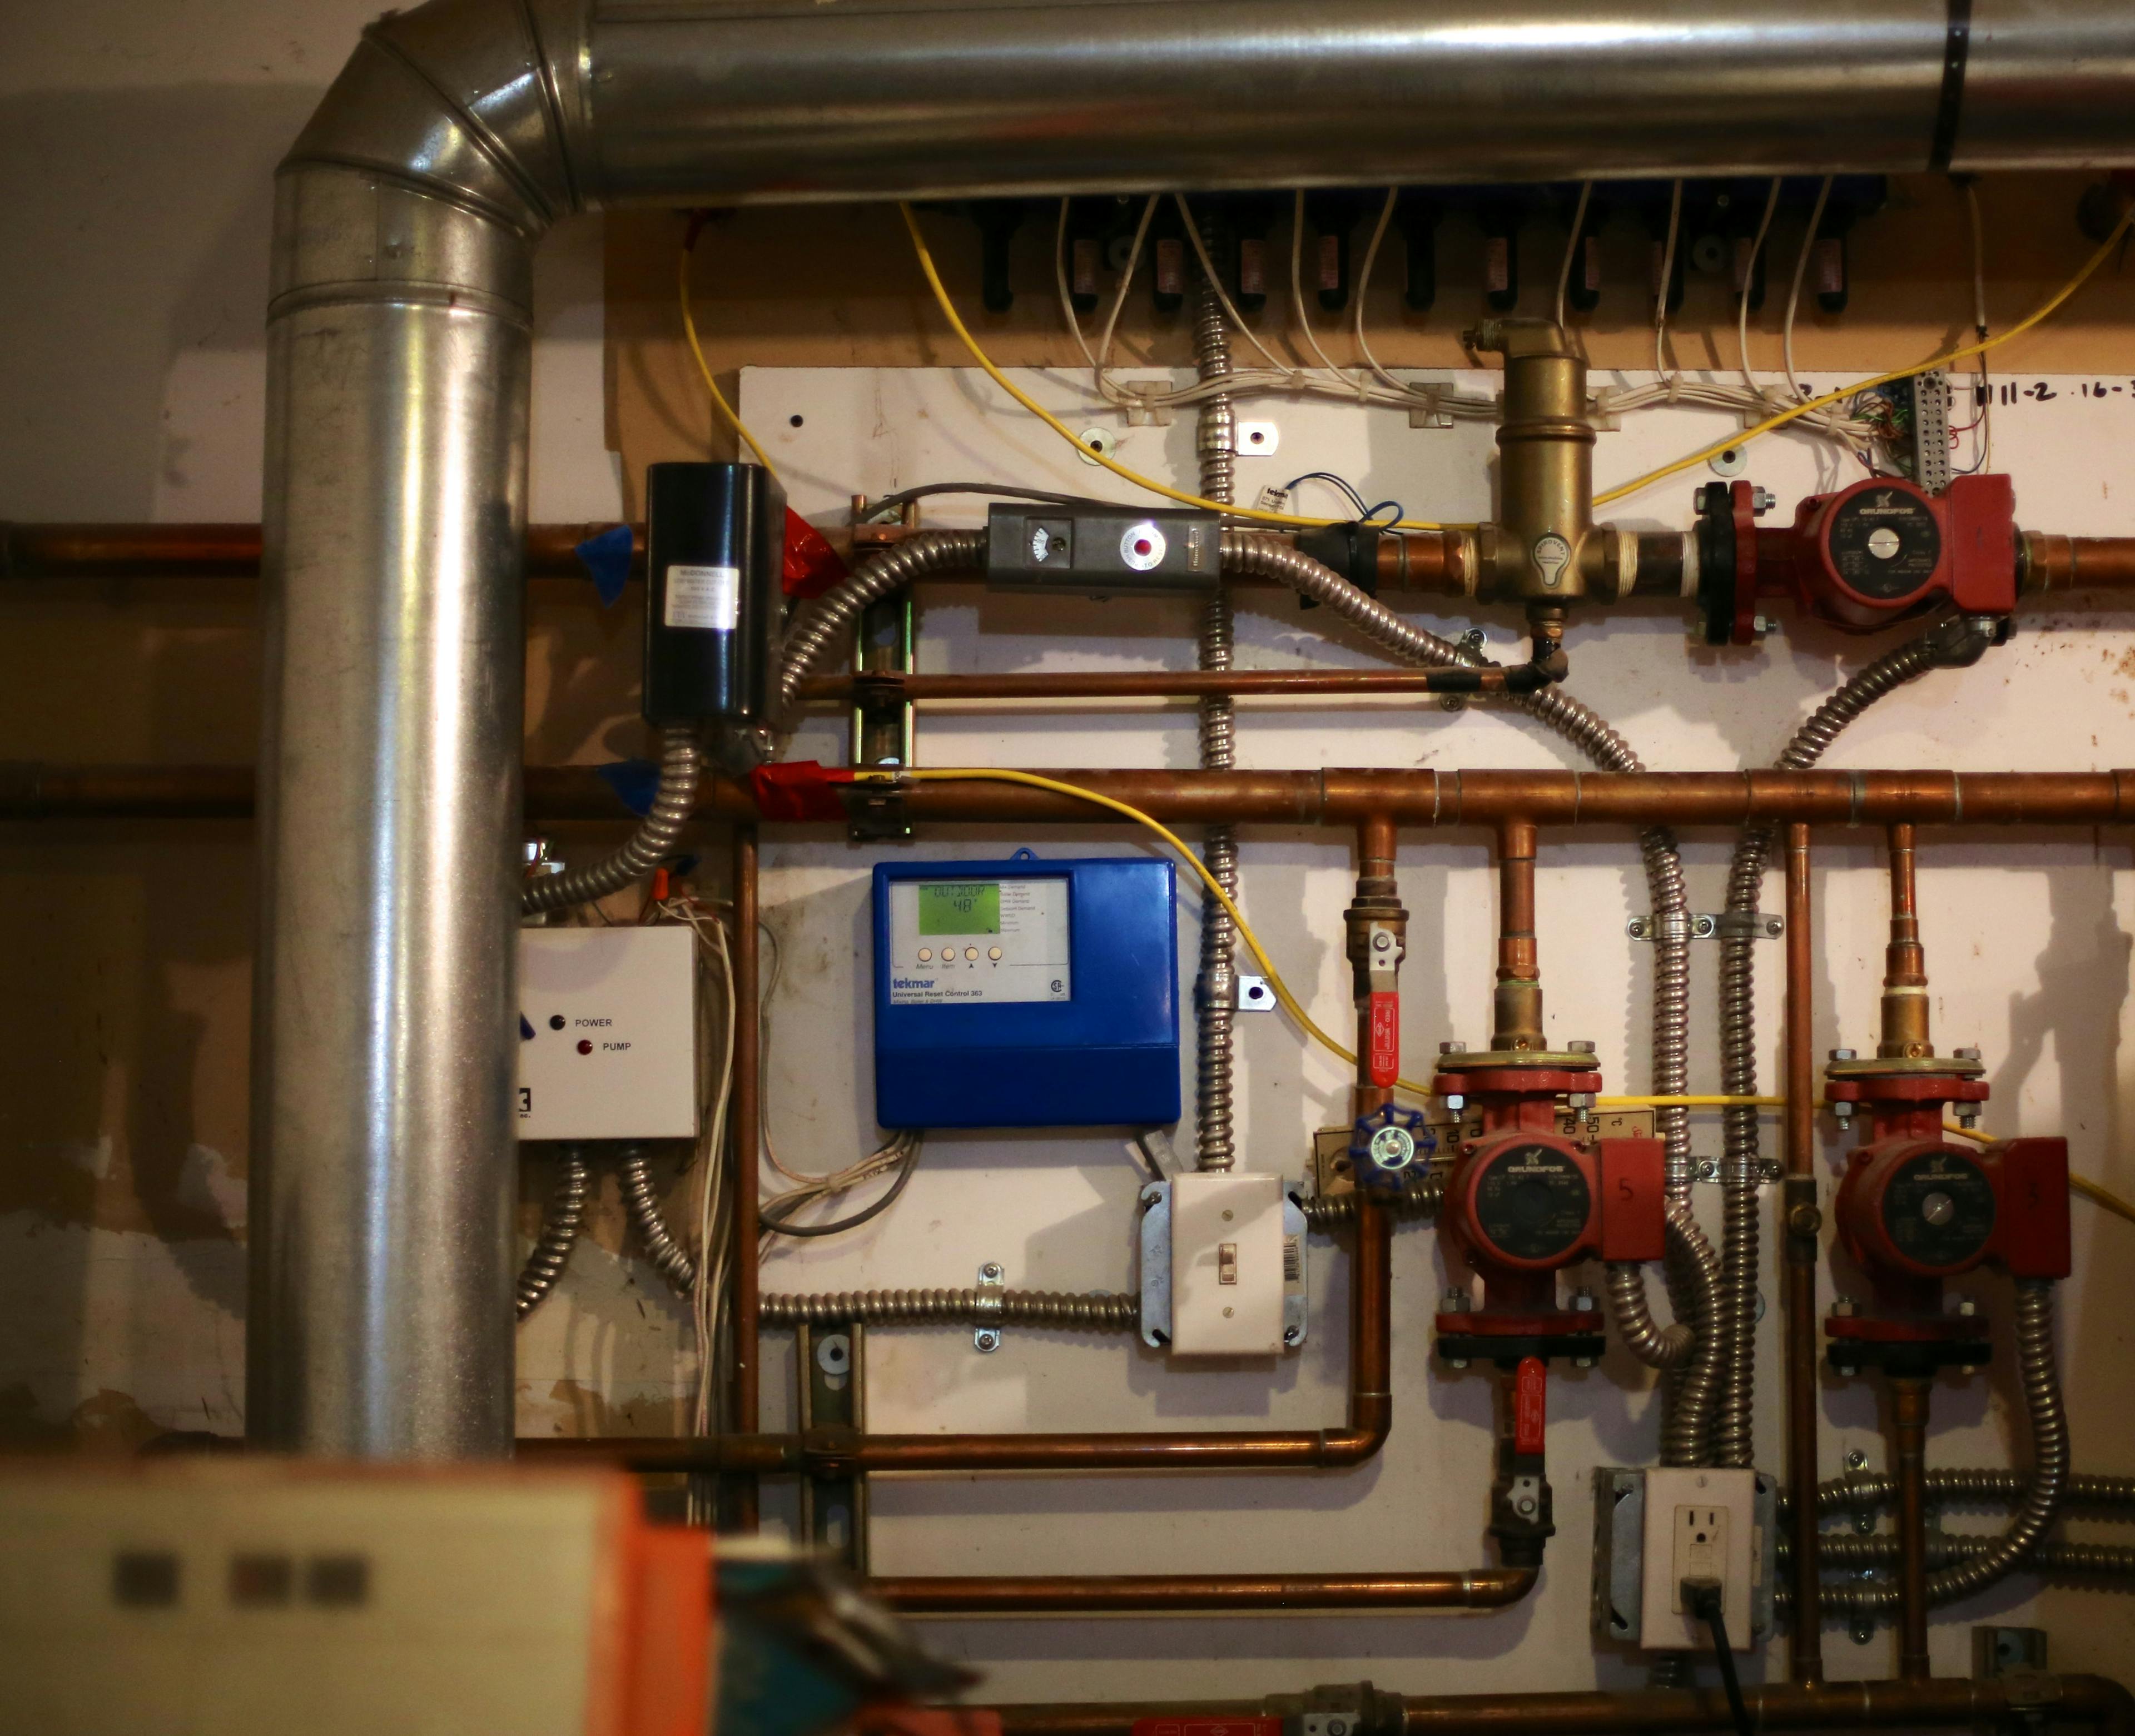
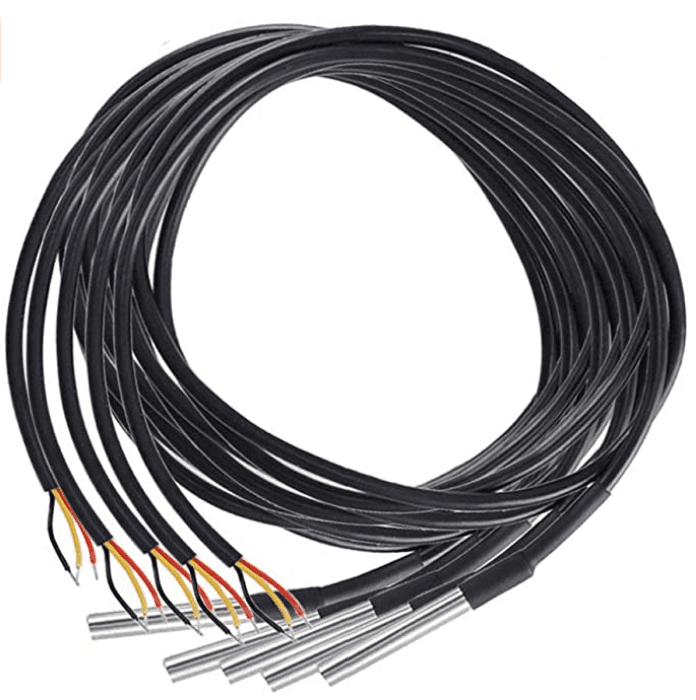
The yellow cable contains 10 temperature sensors, each strapped to an individual pipe in the boiler system
The latest addition to my home automation system is a set of 10 DS18B20 temperature sensors that monitor all aspects of our underfloor heating system. Each zone has a hot pipe going out to it and a cold pipe coming back. There are also sensors on the pipes to and from the boiler and on the hot water tank pipes.
The sensors are mounted on small pieces of circuit board which were then soldered in-line in a CAT5 cable then covered in heat-shrink tubing but leaving the sensor body exposed. The sensor is then taped onto the pipe. By marking the wire ahead of time each sensor was placed at the right spot to align with the pipes I wanted to monitor.
The heating system in this case is a fairly complex one with four separate zones, a hot loop to the boiler and the hot water tank and then 'mixed' loops to serve each zone. There's a controller that has a few temperature sensors including one outside so it can adjust the temperature of the water to the floor according to the ambient temperature also. For the most part it's been a very reliable system and unlike a forced air system this one needs a very small current to keep the pumps running in the event of a power outage.
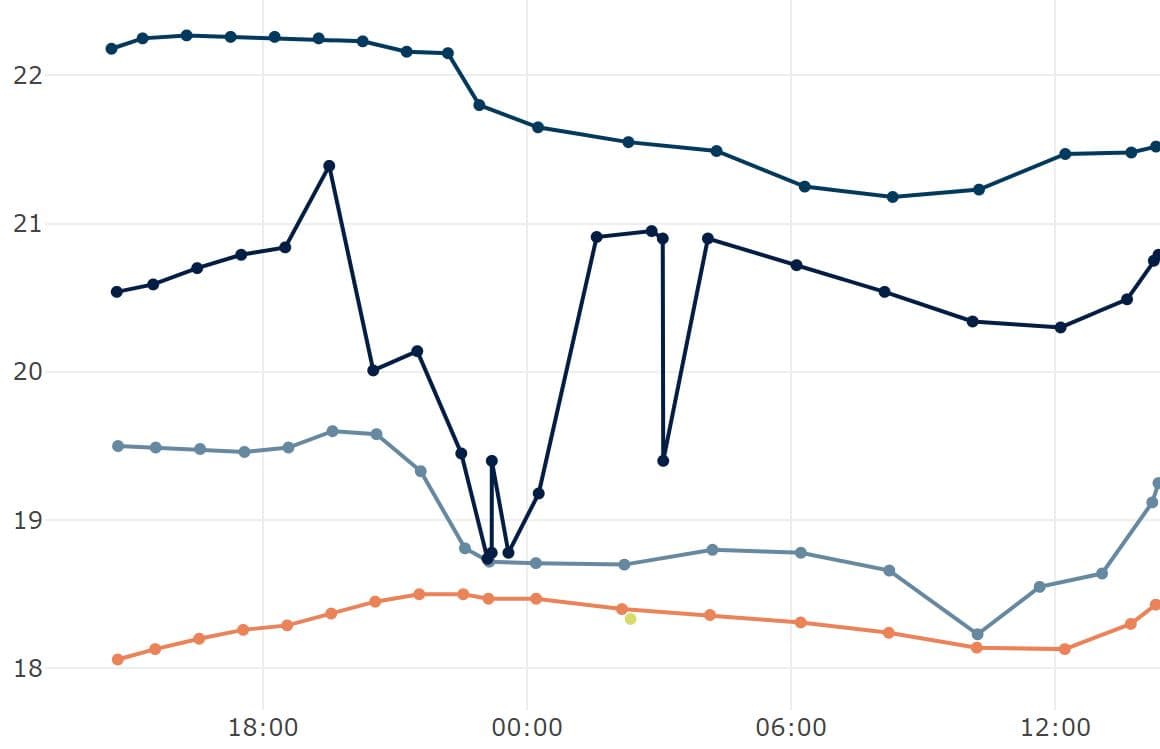
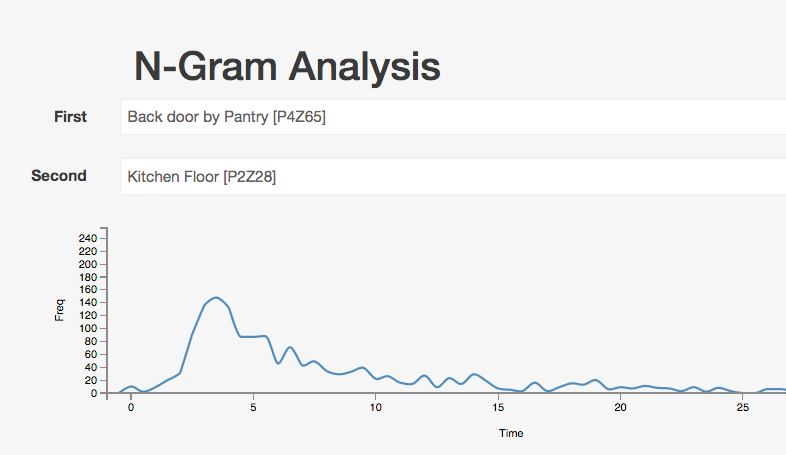
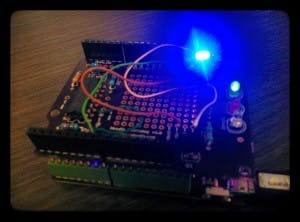
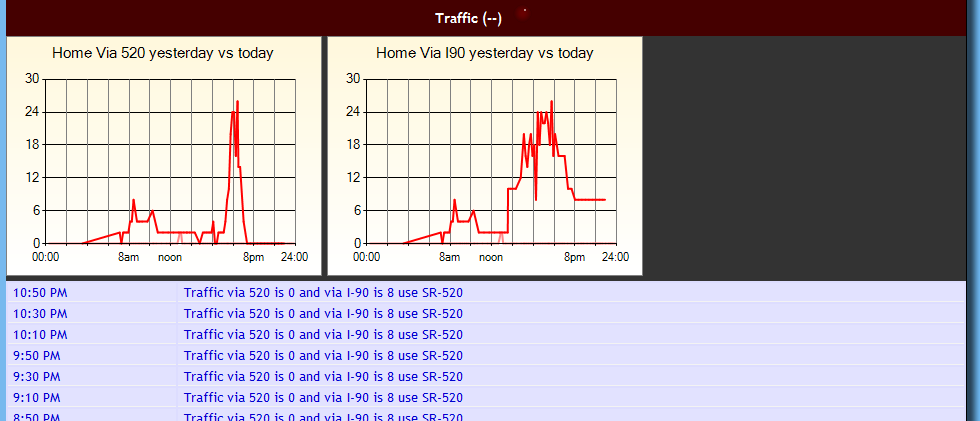
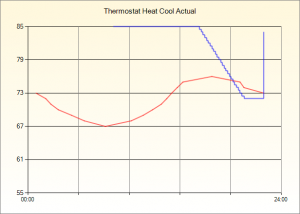
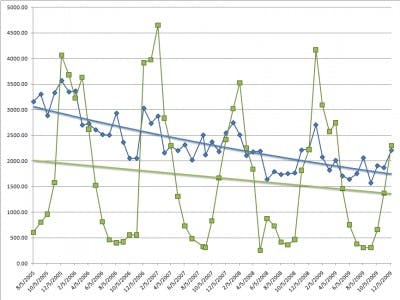
On the other end of the CAT5 wire is a Arduino running a simple polling loop that posts the temperatures to my home automation server whenever they change by more than 0.5 of a degree Celsius. One interesting tweak on the protocol I created for that API is that the server replies with a message that says how often it wants to receive updates and to what accuracy. That way I can update the server and all the Netduino hosted sensors around the house will change their update frequency or accuracy. Other than that the API is a simple POST of the temperature value to an address that includes the OneWire unique identifier. The home automation server collects all these timed-values, stores them in MongoDB and provides some analysis capabilities on top. Each sensor has its own graph, or I can define graphs like the one shown here that combine two sensors: an input and an output so you can see what the temperature drop (or gain) is.
Uses
The graphs generated by what is really a fairly simple boiler controller are surprisingly complex. Between the boiler running, the mixing valves opening and the valves to individual zones opening and closing, the temperature graphs trace some fairly complex patterns. My initial observation is that the boiler is running far more often than I would have expected so I'll be trying to figure out why that is happening and what I can change in my thermostat setting algorithms so it runs less often. I'm also wondering if I can tweak the controller's various set points to make the system work more efficiently, e.g. reduce the water temperature going to the zones by a degree or two.
Longer-term I'd also like to add some alerting into the system for conditions like the tank temperature falling below a certain set point. This normally indicates that someone has knocked the earthquake-shut-off valve and it needs resetting. I'm also wondering if I can calculate boiler efficiency and create an alert to have it serviced when the efficiency falls below a given value.
