The Blog of Ian Mercer.

Home Automation Heating and Cooling (HVAC) Features
Cover Image for Home Automation Heating and Cooling (HVAC) Features

Now that summer is finally upon us in this part of the world I thought I might make a list of the many ways in which my home automation system monitors and controls the heating and cooling systems (HVAC) in our house.  It does this to reduce energy consumption and to provide a more comfortable environment for the occupants.

Reduced heating/cooling when the house isn't occupied

The house automatically drops back to a lower (or higher in the case of the air-conditioning set-point) setting whenever a zone in the house is unoccupied for a set period.

Further reduction in heating/cooling when the house isn't occupied in the case of a vacation

If the house is totally unoccupied for the majority of the day (i.e. excluding brief visits from cleaners and pet sitters) it will automatically flip into an even lower power consumption mode using less heating and no cooling at all.

Heat-point / cool-point variation by time of day (for each zone)

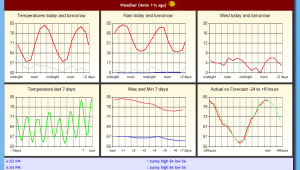
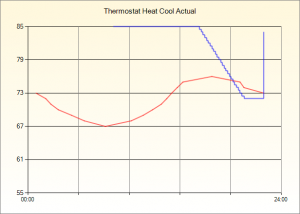
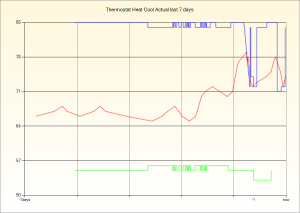
Instead of aiming for a single fixed temperature for a 24 hour period the house has target temperatures for different times of day - at night for example it lowers the heat-point substantially, during the evening it lowers it subtly in preparation for nighttime (except if we have visitors (which it knows)).  On hot summer evenings it will cool the bedrooms in advance of bedtime (as shown in the graph here) but during the night it will allow the temperature to creep up slightly.  Each zone has it's own target temperatures curve because what's right for the bedrooms isn't right for the kitchen.

Optimum start in the morning

A traditional thermostat with a timer typically simply slams the thermostat up to 68F at, say, 5AM every morning to get the house to the right temperature by the time we wake up.  My smart house instead follows an 'optimum start' routine whereby it gradually increases the set-point every five minutes along a predefined curve that matches the house's thermal characteristics for heating (which varies according to the outside temperature).  This means it heats the house for the absolute minimum duration necessary to arrive at the correct temperature by the desired time of day.  A traditional thermostat by contrast may have been holding the house at 68 for an hour or more before it was really necessary.

No heating of cooling at all if the weather forecast says it's not needed

If the house is going to get warm all on its own today because it's forecast to be a hot sunny day then the house will automatically skip all heating in the morning even if it means the house will be a few degrees cooler than desired for an hour or so in the morning.  When it's sunny and the forecast is for a hot day there's no point heating just to increase comfort for such a short period and besides when it's sunny outside people don't feel as cold anyway.  This also means that the house will not need as much cooling later should it be a really hot day.

Another example of this can be seen in the graph above where the house decided to stop cooling the upper floor because the forecast indicated that it would soon be cool enough outside to not require any A/C and it would be cheaper and more effective to just suck in air from outside.

Manual override and the subtle shift back to computer control

There are unfortunately many people in the world who don't understand thermostats let alone thermodynamics.  For some there is a perception that the higher you set it, the faster it will get warm.  Rather than try to reason with such people, or offend them with rude alerts or announcements over the speakers to explain how thermostats work, my home takes a more subtle approach: you can set the thermostat to whatever value you like but within an hour it will have taken back control and the set point will be back to where it should be.

Thermostats are part of the occupancy sensing network in the house

If you adjust a thermostat that counts as an occupancy trigger in the room in which the thermostat is located.  In order to have the densest possible network of occupancy sensors any device that receives input is treated as an occupancy sensor, so thermostats, light switches, TV remotes all act as occupancy sensors just like the more traditional door sensors, motion sensors, floor sensors etc.

The house refuses to attempt to cool the entire world - Close the doors!

If the house is in cooling mode and external doors are left open it will wait for 5 minutes, then issue a verbal warning over the speakers, and then if the doors are still left open it will simply stop trying to cool that zone until the doors are closed.

The house logs what happened in each zone and can explain why it made changes

Any complex system will have unexpected behaviors, but unlike other home automation systems this one keeps a detailed individual log for each zone and in that log you can see what happened and equally importantly why it happened because the house leaves a trail including explanations as to what it was doing and why.

    9:16 PM  Temperature 67°F [64°F \< |65.3°F| \< 68°F]
    7:05 PM  Heatpoint changed to 55 because warm outside (Outside ave=57.2°F now=65.0°F)
    6:38 PM  Temperature 68°F [64°F \< |65.0°F| \< 68°F]
    3:01 PM  Heatpoint changed at thermostat to 66°F
    3:01 PM  Heating (Off)
Home Automation Thermostat
Graph

The house makes graphs for each zone

These graphs show how the temperature varied and what changes it was making to the set points during the course of the day

These cooling and heating features together with all of the other home automation features directed at energy saving mean that our total electricity consumption is down 40% from where it was five years ago and comfort has if anything improved along with convenience - it's very rare now that we ever need to adjust a thermostat.

Future improvements

Although the house can tell if we are home or away, or if we have visitors for the evening or visitors stopping over all without being told, it still can't figure out when we will get home.  But that's about to change, the house now knows where we are when we aren't at home (more about that later) and it will soon be able to predict a return time.  Armed with that I hope to improve it so it can have the house ready for our return after we've been away without having to explicitly tell it anything!

Home Automation
HVAC

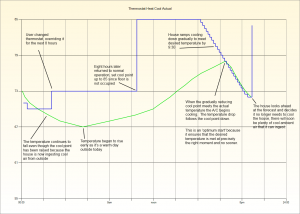
A more detailed example: Click the image on the right to enlarge it. You'll see a detailed example of how the house manages the cool point to achieve optimum comfort with minimal energy consumption.
Related Stories

Cover Image for Time Series Data Compression

Time Series Data Compression

This new technique to compress the time series data collected by my home automation system seems to be working really well.
Ian Mercer
Ian Mercer
Cover Image for Home Automation

Home Automation

I've been working on home automation for over 15 years and I'm close to achieving my goal which is a house that understands where everyone is at all times, can predict where you are going next and can control lighting, heating and other systems without you having to do or say anything. That's a true "smart home".

Ian Mercer
Ian Mercer
Cover Image for Home Automation Sensors

Home Automation Sensors

An overview of the many sensors I've experimented with for home automation including my favorite under-floor strain gauge, through all the usual PIR, beam and contact sensors to some more esoteric devices like an 8x8 thermal camera.

Ian Mercer
Ian Mercer
Cover Image for Collinearity test for sensor data compression

Collinearity test for sensor data compression

One way to reduce the volume of sensor data is to remove redundant points. In a system with timestamped data recorded on an irregular interval we can achieve this by removing co-linear points.

Ian Mercer
Ian Mercer
Cover Image for Event blocks

Event blocks

Home automation systems need to respond to events in the real world. Sometimes it's an analog value, sometimes it's binary, rarely is it clean and not susceptible to problems. Let's discuss some of the ways to convert these inputs into actions.

Ian Mercer
Ian Mercer
Cover Image for Logistic function - convert values to probabilities

Logistic function - convert values to probabilities

Another super useful function for handling sensor data and converting to probabilities is the logistic function 1/(1+e^-x). Using this you can easily map values onto a 0.0-1.0 probability range.

Ian Mercer
Ian Mercer
Cover Image for ATAN curve for probabilities

ATAN curve for probabilities

In a home automation system we often want to convert a measurement into a probability. The ATAN curve is one of my favorite curves for this as it's easy to map overything onto a 0.0-1.0 range.

Ian Mercer
Ian Mercer
Cover Image for Probabilistic Home Automation

Probabilistic Home Automation

A probabilistic approach to home automation models the probability that each room is occupied and how many people are in that room.

Ian Mercer
Ian Mercer
Cover Image for Multiple hypothesis tracking

Multiple hypothesis tracking

A statistical approach to understanding which rooms are occupied in a smart house

Ian Mercer
Ian Mercer
Cover Image for A state machine for lighting control

A state machine for lighting control

An if-this-then-that style rules machine is insufficient for lighting control. This state machine accomplishes 90% of the correct behavior for a light that is controlled automatically and manually in a home automation system.

Ian Mercer
Ian Mercer
Cover Image for Home Automation States

Home Automation States

Understanding the many different 'states' a house can have is critical to creating great home automation

Ian Mercer
Ian Mercer
Cover Image for Graphing gigabytes of home automation data with tableau

Graphing gigabytes of home automation data with tableau

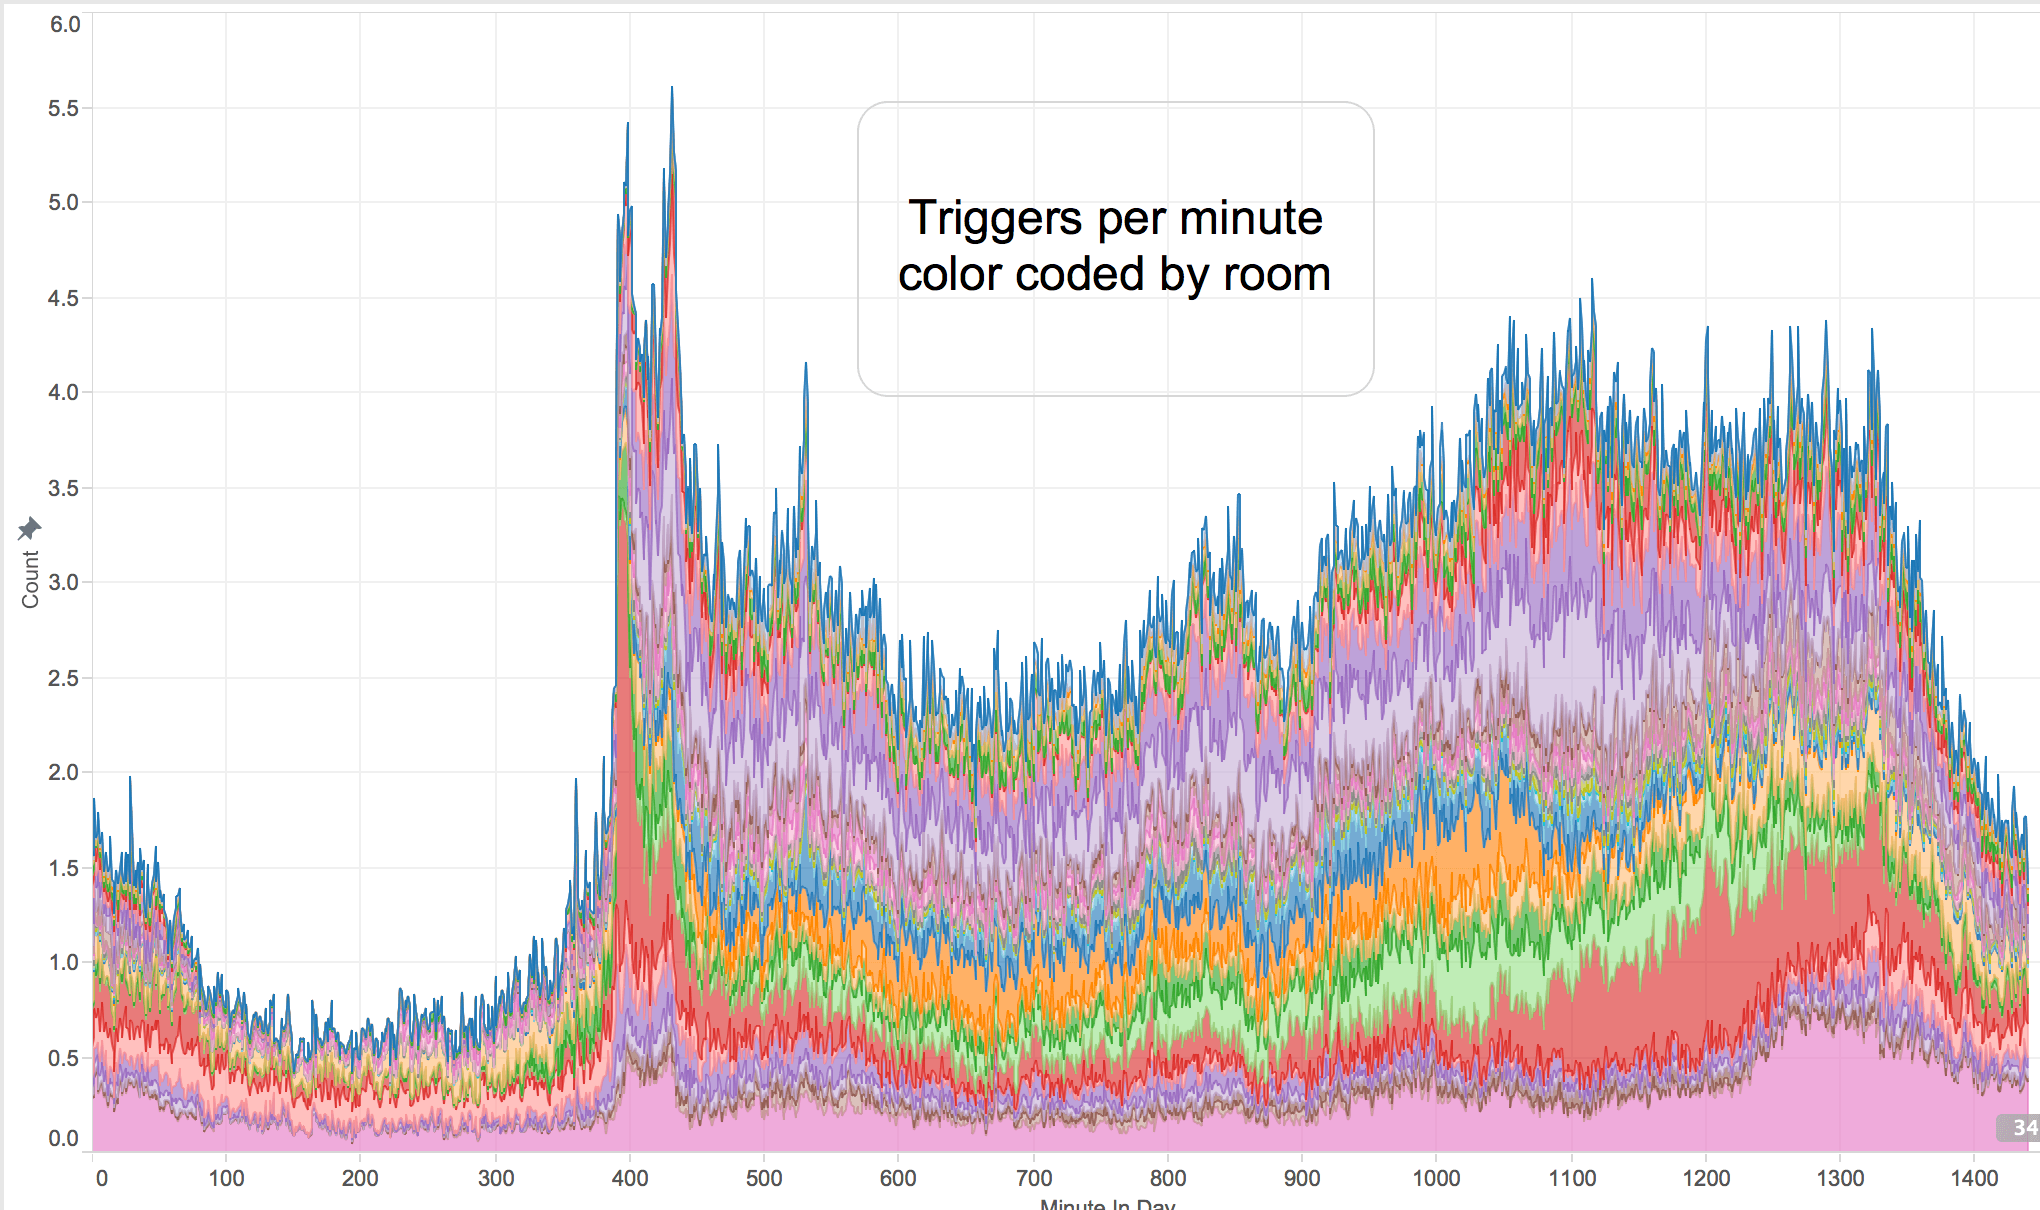
Some interesting charts from the gigabytes of data my home automation system produces

Ian Mercer
Ian Mercer
Cover Image for iBeacons for Home Automation

iBeacons for Home Automation

My investigations into using iBeacons for home automation

Ian Mercer
Ian Mercer
Cover Image for iBeacon meetup in Seattle - January 2015

iBeacon meetup in Seattle - January 2015

My notes on the iBeacon meetup in Seattle held in January 2015

Ian Mercer
Ian Mercer
Cover Image for Home Automation Systems as a Graph

Home Automation Systems as a Graph

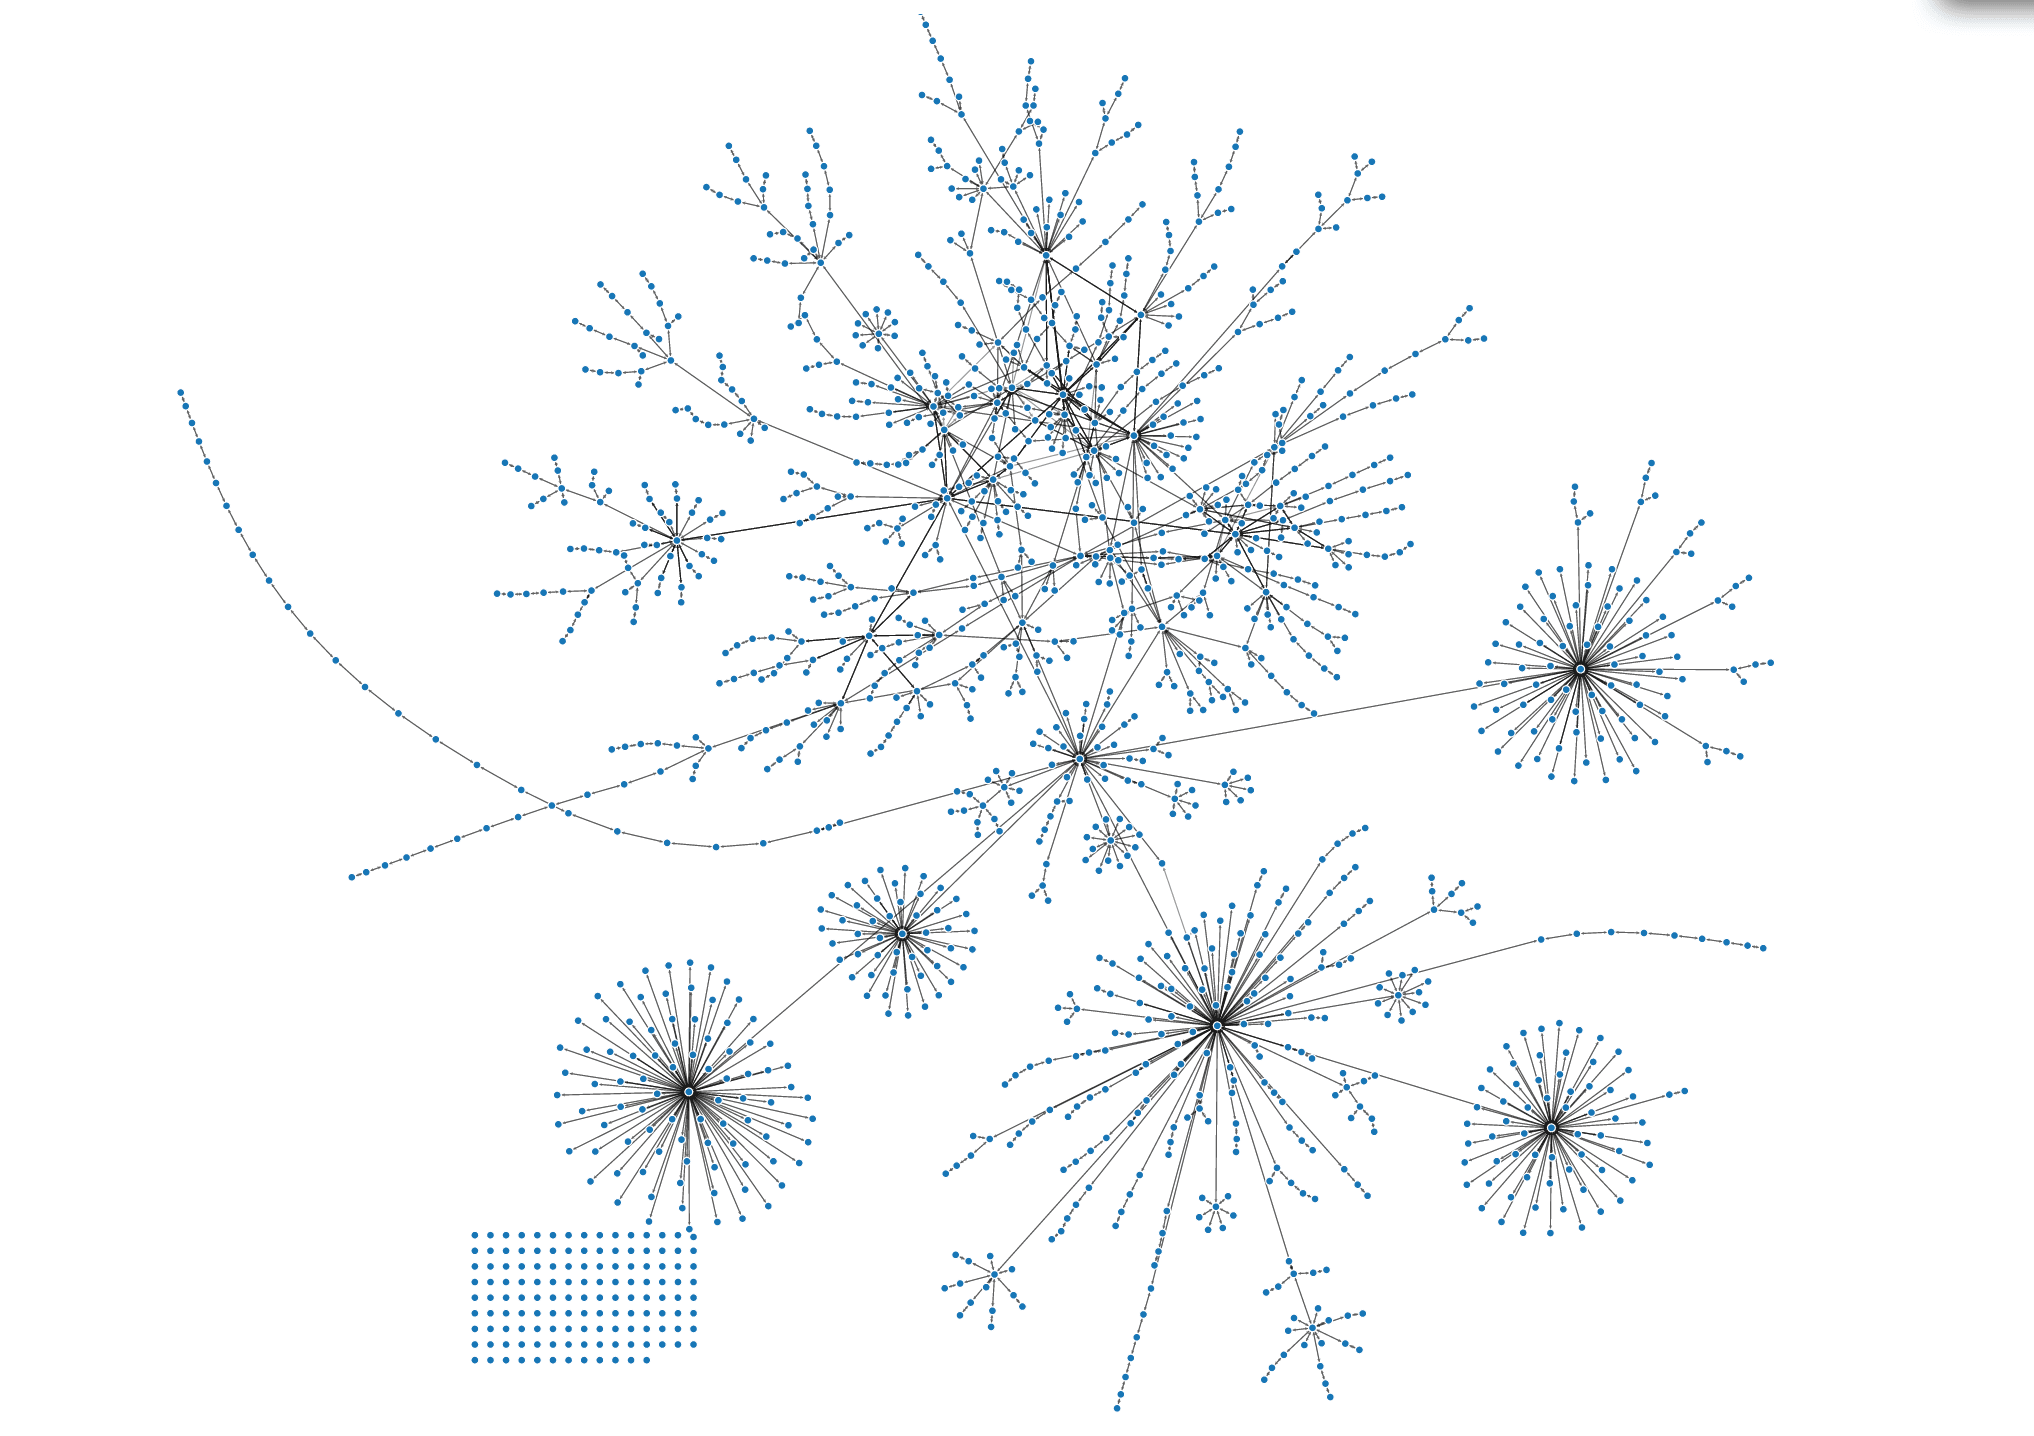
Using nodes and links to represent a home and all the devices in it

Ian Mercer
Ian Mercer
Cover Image for N-Gram Analysis of Sensor Events in Home Automation

N-Gram Analysis of Sensor Events in Home Automation

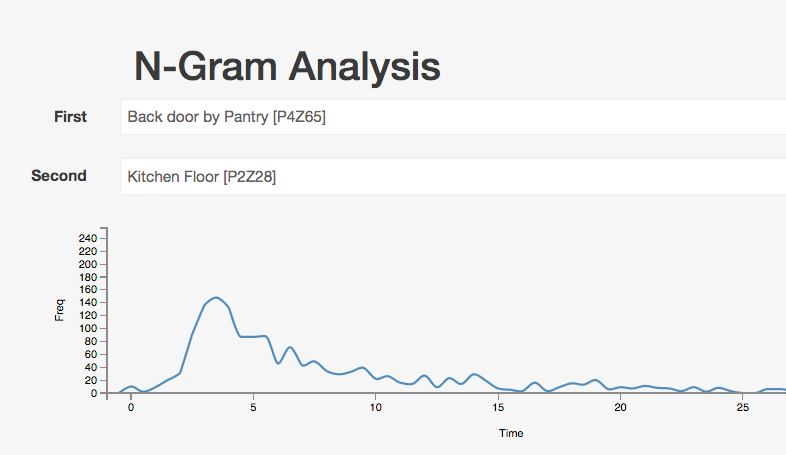
Using n-gram analysis to spot patterns in sensor activations

Ian Mercer
Ian Mercer
Cover Image for Xamarin Forms Application For Home Automation

Xamarin Forms Application For Home Automation

Building a Xamarin Forms application to control my home automation system

Ian Mercer
Ian Mercer
Cover Image for The Internet of Hubs (and things)

The Internet of Hubs (and things)

Maybe it should be called the Internet of Hubs instead

Ian Mercer
Ian Mercer
Cover Image for Showing home status with just a single RGB LED

Showing home status with just a single RGB LED

Multicolored LEDs can convey a lot of information in a small space

Ian Mercer
Ian Mercer
Cover Image for A wireless sensor network using Moteino boards

A wireless sensor network using Moteino boards

The diminutive Arduino boards include a powerful transmitter/receiver

Ian Mercer
Ian Mercer
Cover Image for The home as a user interface

The home as a user interface

Ian Mercer
Ian Mercer

A RESTful API for sensor data

POSTing data to a home automation system from Arduino devices

Ian Mercer
Ian Mercer
Cover Image for The Internet of Boilers

The Internet of Boilers

An experiment to measure every aspect of an HVAC / boiler system

Ian Mercer
Ian Mercer

VariableWithHistory - making persistence invisible, making history visible

A novel approach to adding history to variables in a programming language

Ian Mercer
Ian Mercer
Cover Image for A Quantified House - My Talk to the Seattle Quantified Self Meetup

A Quantified House - My Talk to the Seattle Quantified Self Meetup

My talk to the Seattle Quantified Self meetup

Ian Mercer
Ian Mercer

Integrating an Android phone into my home automation system

Some new features for my home automation using an Android phone

Ian Mercer
Ian Mercer
Cover Image for The Internet of Dogs

The Internet of Dogs

Connecting our dog into the home automation

Ian Mercer
Ian Mercer
Cover Image for GreenGoose Review

GreenGoose Review

A review of the now defunct GreenGoose sensor system

Ian Mercer
Ian Mercer
Cover Image for Home power meters revisited

Home power meters revisited

Ian Mercer
Ian Mercer
Cover Image for Home Automation Calendar Integration

Home Automation Calendar Integration

Ian Mercer
Ian Mercer

Smart home energy savings - update for 2010

Ian Mercer
Ian Mercer
Cover Image for A smart power strip

A smart power strip

Ian Mercer
Ian Mercer
Cover Image for What does a Smart House do at Halloween?

What does a Smart House do at Halloween?

My favorite home automation features for Halloween

Ian Mercer
Ian Mercer
Cover Image for Home Automation Top Features

Home Automation Top Features

Ian Mercer
Ian Mercer
Cover Image for Weather Forecasting for Home Automation

Weather Forecasting for Home Automation

Ian Mercer
Ian Mercer
Cover Image for How can I tell if my house is smart?

How can I tell if my house is smart?

Ian Mercer
Ian Mercer

Home Automation Block Diagram

Ian Mercer
Ian Mercer

World's Smartest House Demonstration

Ian Mercer
Ian Mercer

Future proof your home with a new conduit system?

Running conduit can be expensive but maybe you don't need one to every room

Ian Mercer
Ian Mercer
Cover Image for New Home Automation Server

New Home Automation Server

Ian Mercer
Ian Mercer
Cover Image for World's Smartest House

World's Smartest House

Over 15 years of experimentation with home automation

Ian Mercer
Ian Mercer
Cover Image for World's Smartest House Videos

World's Smartest House Videos

A collection of videos about my smart home efforts

Ian Mercer
Ian Mercer